When it comes to organizing data for your team, Airtable is one of the best apps available. With features like linked records, customizable filters and views, workflow automation, and visual interfaces, Airtable can completely transform the way you work.
In this second part of our Airtable Beginner’s guide, we’ll give you a closer look at all of those features so you can start building and sharing more advanced databases.
Let’s continue our deep dive into Airtable with a look at linked records and lookups. Linked records are a handy feature in Airtable that allow you to associate records between two different tables.
This makes it easy to build complex relationships between your data, and ensures that your records stay organized and connected.
Here’s a quick overview of how linked records work:
1. Create two tables that you want to link. Both must be in the same base.
2. In either table, create a new field.
3. Choose “Link to another record” as the field type.
4. Select the table you want to link to.
5. Save your new Linked Record field.
6. (Optional) Add lookup fields to display additional data from the linked record.
Let’s dive into further detail with an example.
Let's say you have two tables in your Airtable base: "Clients" and "Project Managers". You want to be able to associate each Client with the Project Manager who is assigned to them.
Here's how you can use linked records to accomplish this.
In the "Clients" table, add a new field called "Project Manager". Set the field type to "Link to another record".
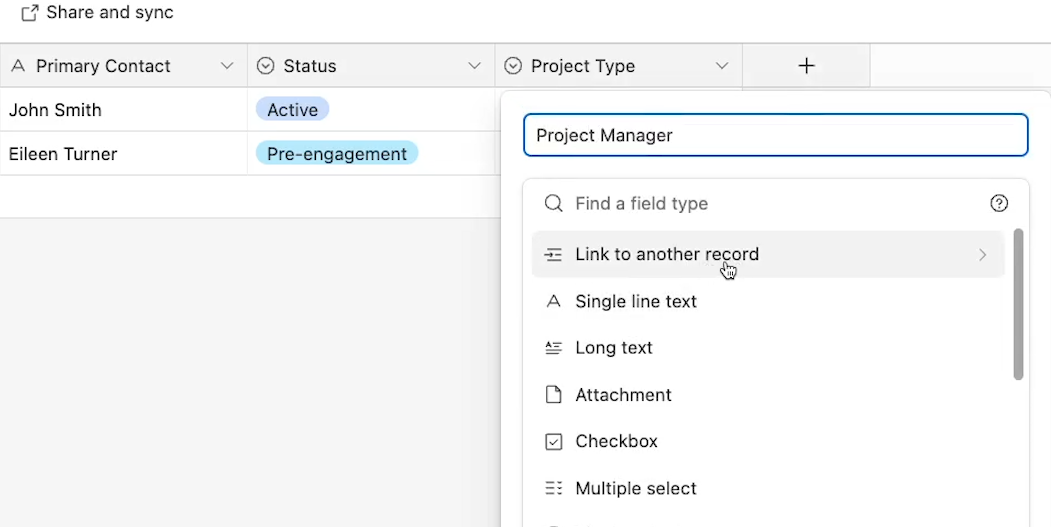
In the "Link to" section, select the table that you want to link to. In this example, that will be the "Project Managers" table.
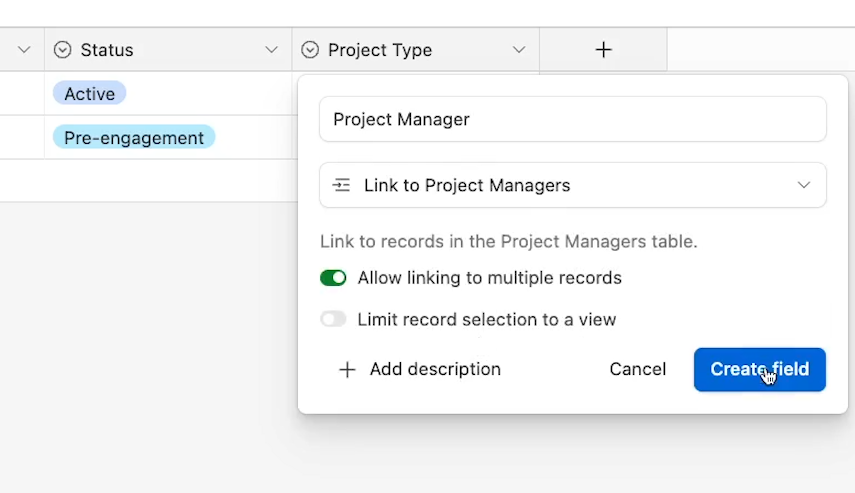
When you save the field, you'll see a new column with the title "Project Manager" appear in your "Clients" table. This column will be a link to the "Project Managers" table.
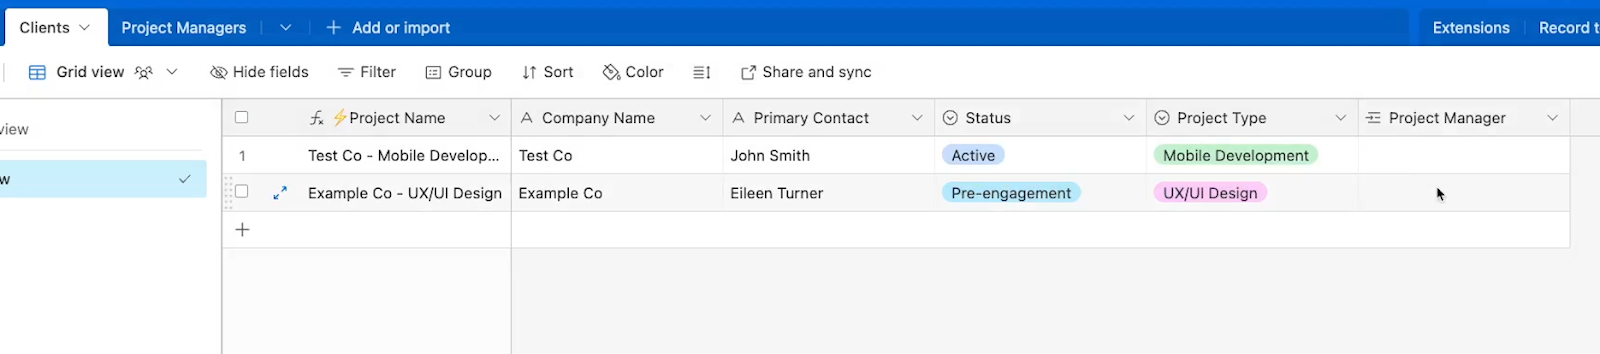
To link a Client record to a Project Manager record, click on the cell in the "Project Manager" column for that record.
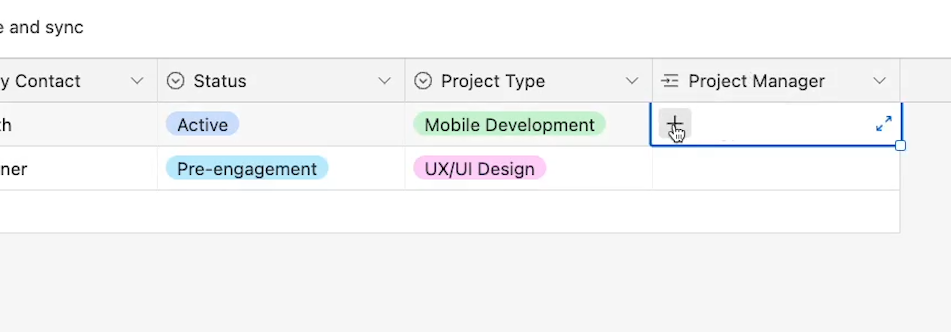
A pop-up menu will appear, allowing you to select the Project Manager record you want to link to. Note that the dropdown menu displays each record using the Primary field as the label.
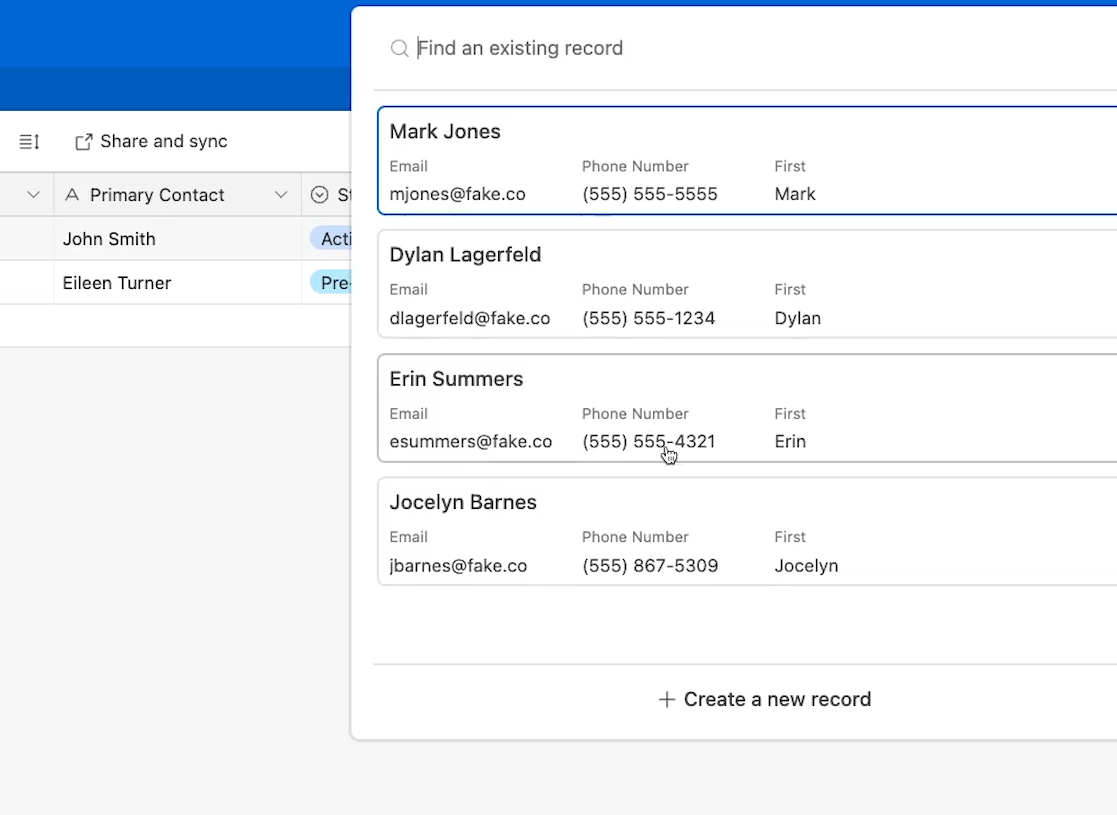
This is another reason why we like to use a formula to populate the primary field, as we mentioned in the first part of this guide.
By using a formula to name the primary field, we can ensure that the naming conventions are consistent, making it easy to find the record we need when we’re creating linked records.
We can also quickly update those naming conventions by simply editing the formula, instead of renaming every record manually.
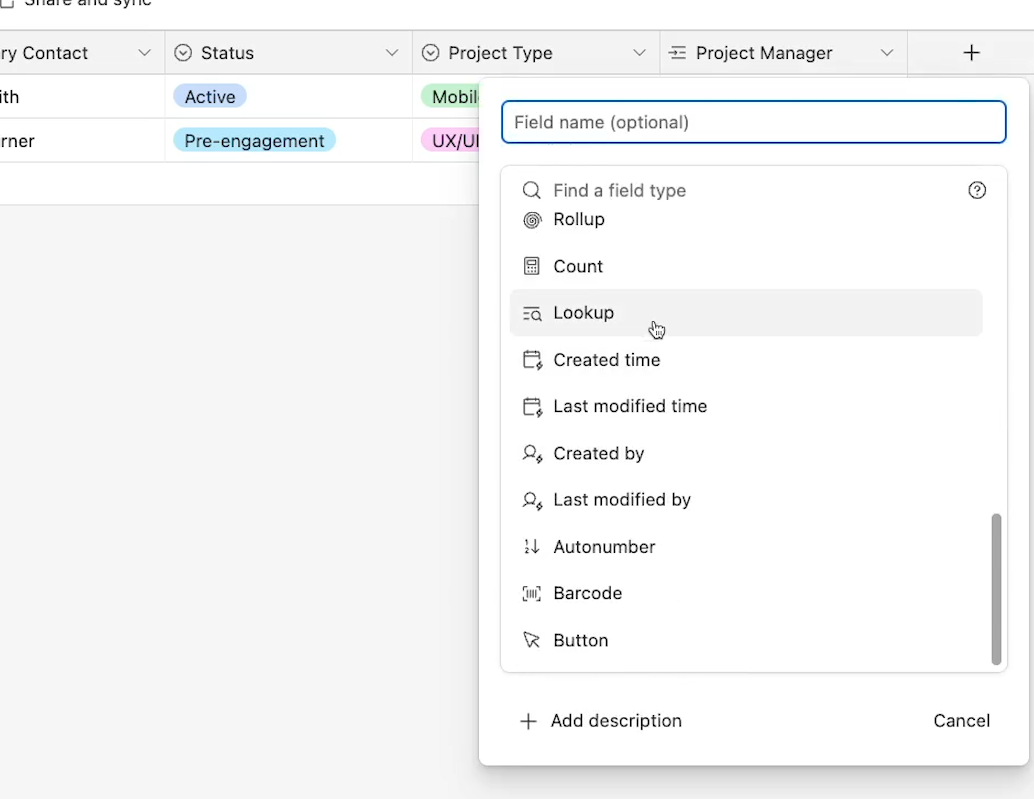
Once you've linked a Client record to a Project Manager record, you can access information from the linked record using lookup fields.
To create a lookup field, add a new field to the table that already contains your linked records, and set the field type to “Lookup”. In our example, we’ll add a Lookup field to our Clients table.
Under the “Configuration” section, select the linked record that you want to add a lookup to. In our example, we’ll choose the "Project Manager" field.
Then, choose the field you want to look up. Note that you’ll need a separate lookup field for each attribute that you want to look up. We’ll start with Email in our example.
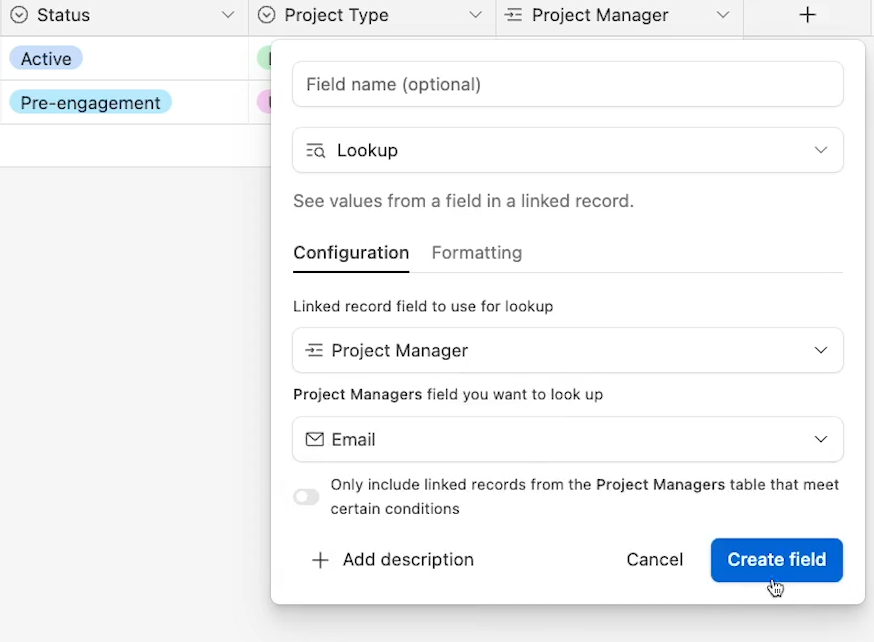
Now we can see the Project Manager’s email address in the clients table whenever we add a PM to a record.

Using linked records and lookups like this can help to prevent redundancies. You’ve already entered the data once in your other table; with a linked record, you don’t have to enter all the same data again.
Plus, it lets you put the same data in multiple places without having to worry about inconsistencies. Whenever you update a record, the update will be reflected automatically in any record that links to it.
In many cases, you might not be sure whether you should use linked records, or just use a single- or multi-select field instead.
In general, you should use linked records whenever you need to access additional attributes from the associated record, and not just a single label or value.
If you only need that one piece of data, using a select field will probably be quicker and easier.
Overall, linked records are a powerful tool that can help you organize and connect your data in Airtable. By linking records between tables and using lookup fields to pull in related data, you can create a robust database that is tailored to your specific needs.
With the addition of linked records and lookups, our base is becoming much more robust and useful. Now, let’s take it even further by adding some custom filters and views.
Filters help you narrow down the records that are visible in a particular view, while views allow you to create different perspectives on your data.
We’ll start with creating a filter.
You can add a filter to any Airtable view with a few quick steps:
1. Click on the “Filters” button at the top of any Airtable view
2. Add at least one condition
3. Save your filter. Any data that doesn’t match your condition(s) will be hidden from the view, but not deleted.
To further illustrate these steps with an example, suppose you have an Employees Directory table which contains information about all the employees in your company. You want to create a filter that only shows new hires – employees who joined within the last month. Here's how to create that filter.
Open the Employees Directory table in Airtable, and click on the "Filter" button in the toolbar. In the window that appears, click on “Add condition” to add a new rule to your filter.

Configure your filter condition. You have extensive options to filter for field contents and values which will vary based on the field type. In our example, we want to only display employees who have a “Date Hired” value that’s a month old or less.
We’ll set our condition to:
where “Date Hired” is on or after “1 month ago”.
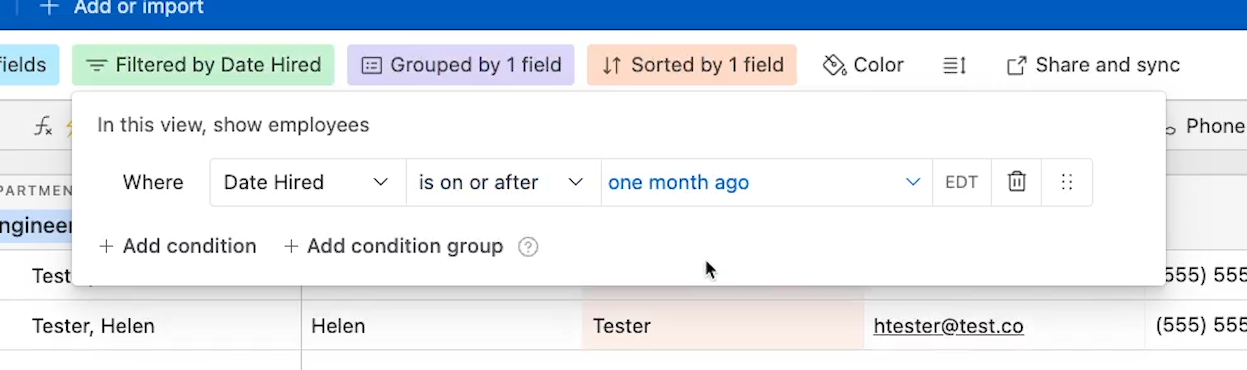
Once you’ve configured your filter condition, click outside of the filter window to save your changes, and you'll see the filtered results in your table.
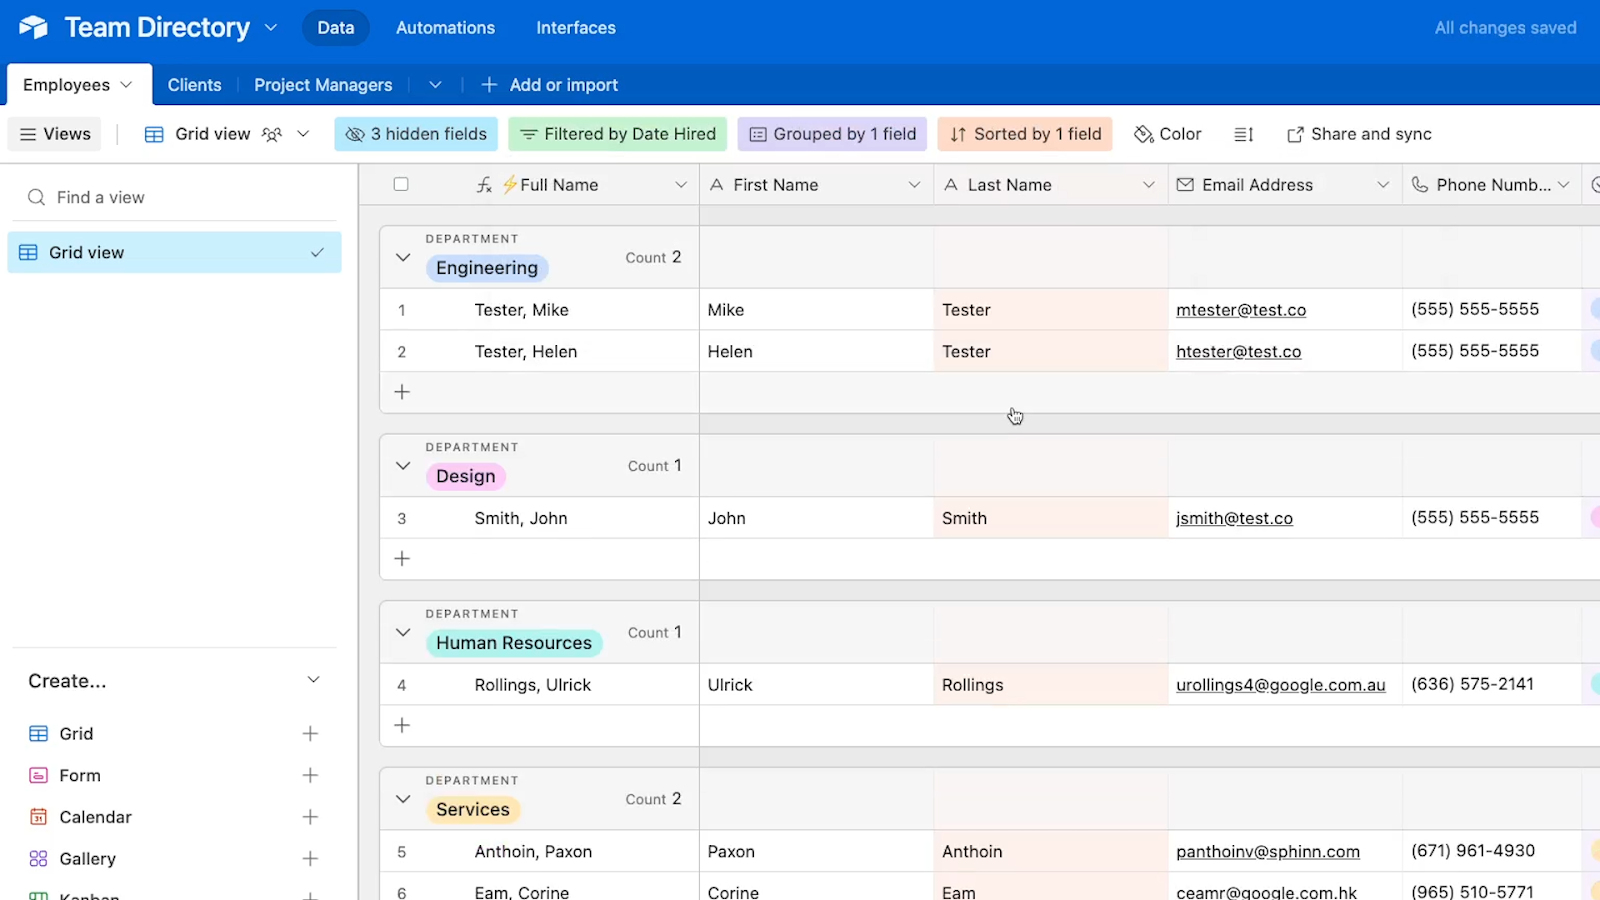
Now that you've created a filter to show new hires, you may want to create a new view that only shows those results.
In Airtable, a “View” is a customizable way to display the data from a table. Each view can use its own type, such as Grid or Kanban, and can have specific filters and sorts that determine which data is displayed.
Here's how to create a new Grid view that uses the filter you just created.
Under the “Create…” section in the left hand menu, click on “Grid”. Give your new view a name, and click “Create new view”.

In your new grid view, click on “Filters” to add the same filter as before to this new view.
Then, go back to the original grid view, delete the filter, and give it a name like “View All”.
Now, you can just switch back and forth between these two views to see all employees, or just new hires.
Note that filters and views will never delete data: they just sort or hide data temporarily based on your configured settings.
These two views are pretty convenient, but grid views are just the start.
Airtable also offers several other types of views that you can use to visualize and organize your data. Read on for a brief overview of each type.
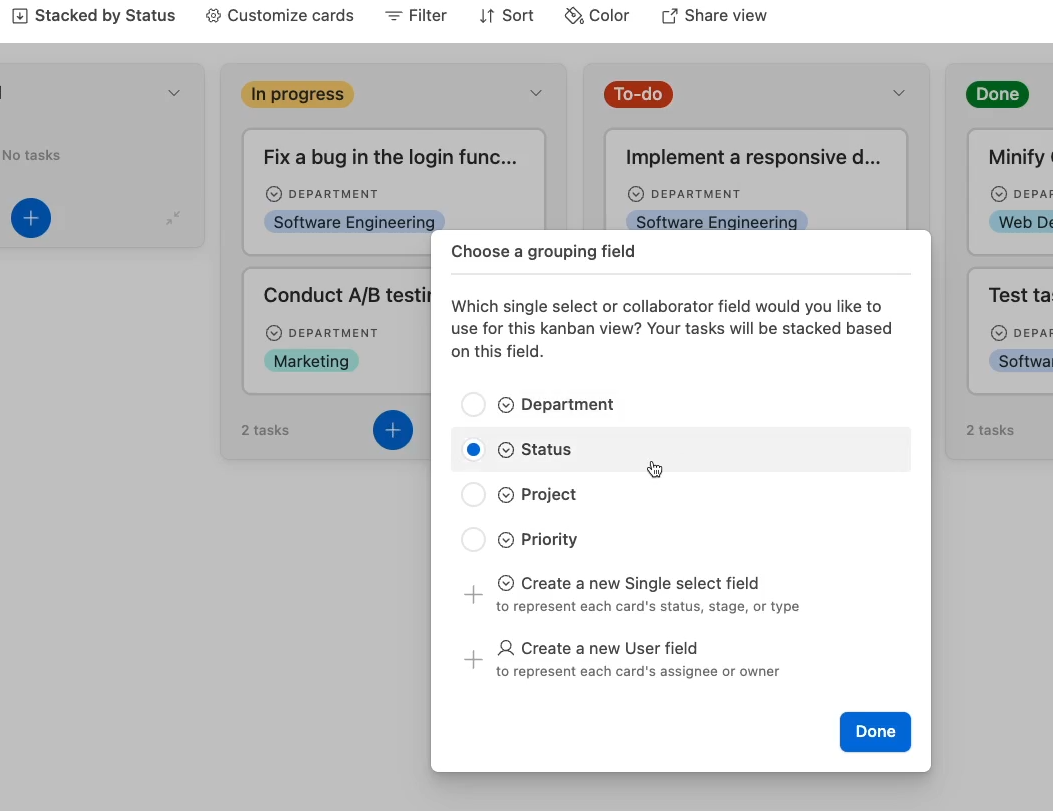
A Kanban view is a board-style view that displays records as cards, which can be dragged and dropped into different columns.
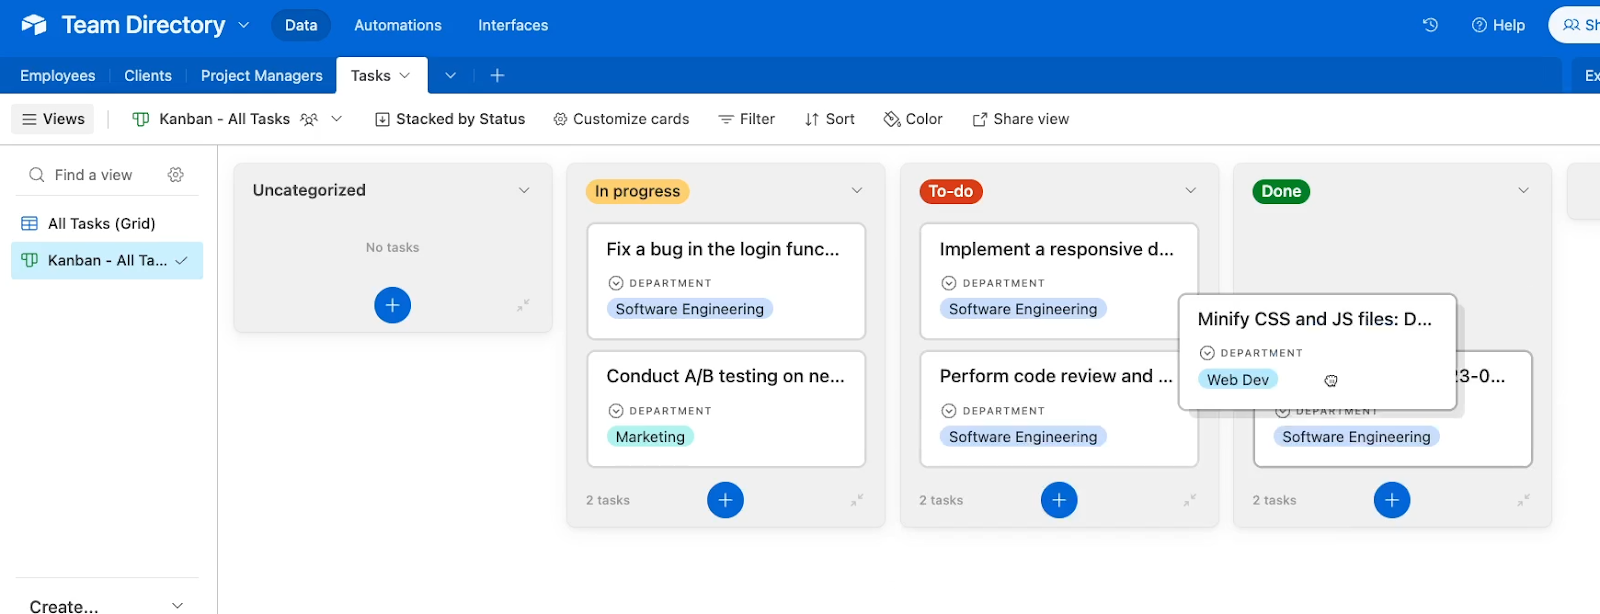
The columns can be mapped to any single-select field, like a “Status” or “Priority” field.
A kanban board is useful for visualizing workflows and progress, and is great for managing a tasks database.
A Timeline view is a chronological view that displays records as events on a timeline. This view is useful for tracking deadlines and high-level milestones.
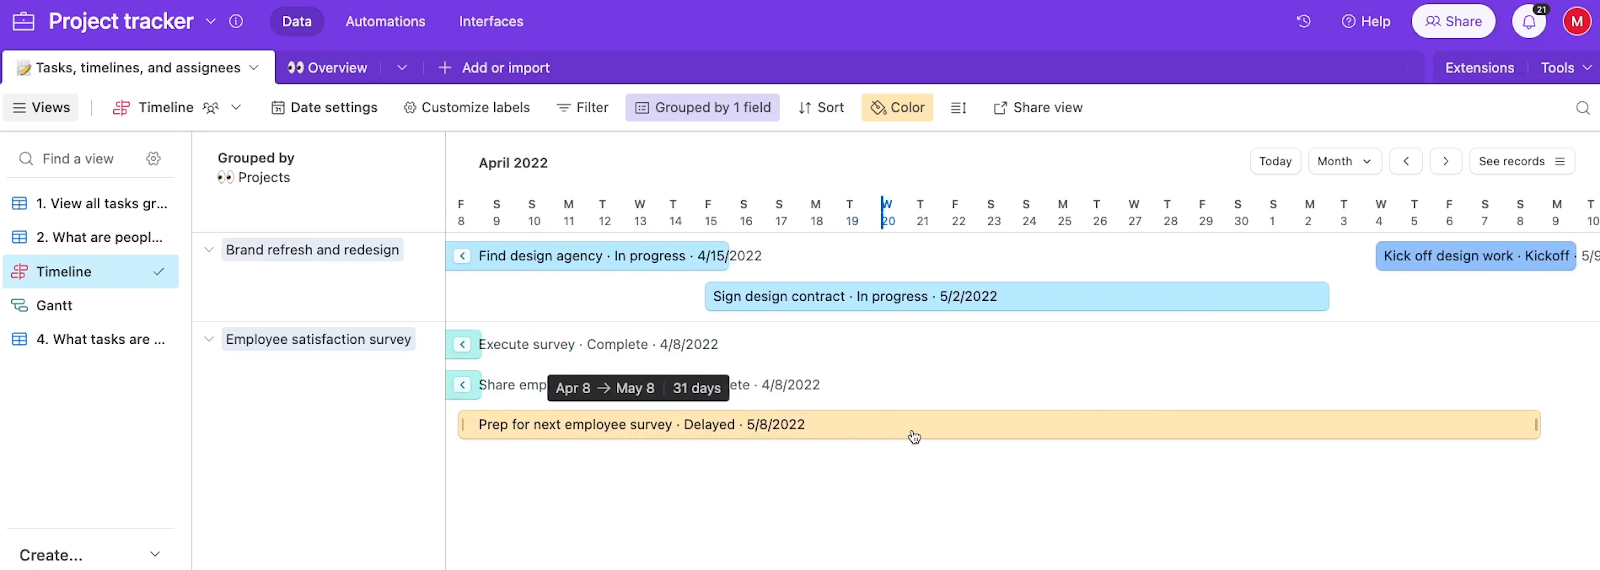
Similar to a timeline view, a Gantt view is a view that displays records as bars on a timeline, and shows dependencies between tasks.
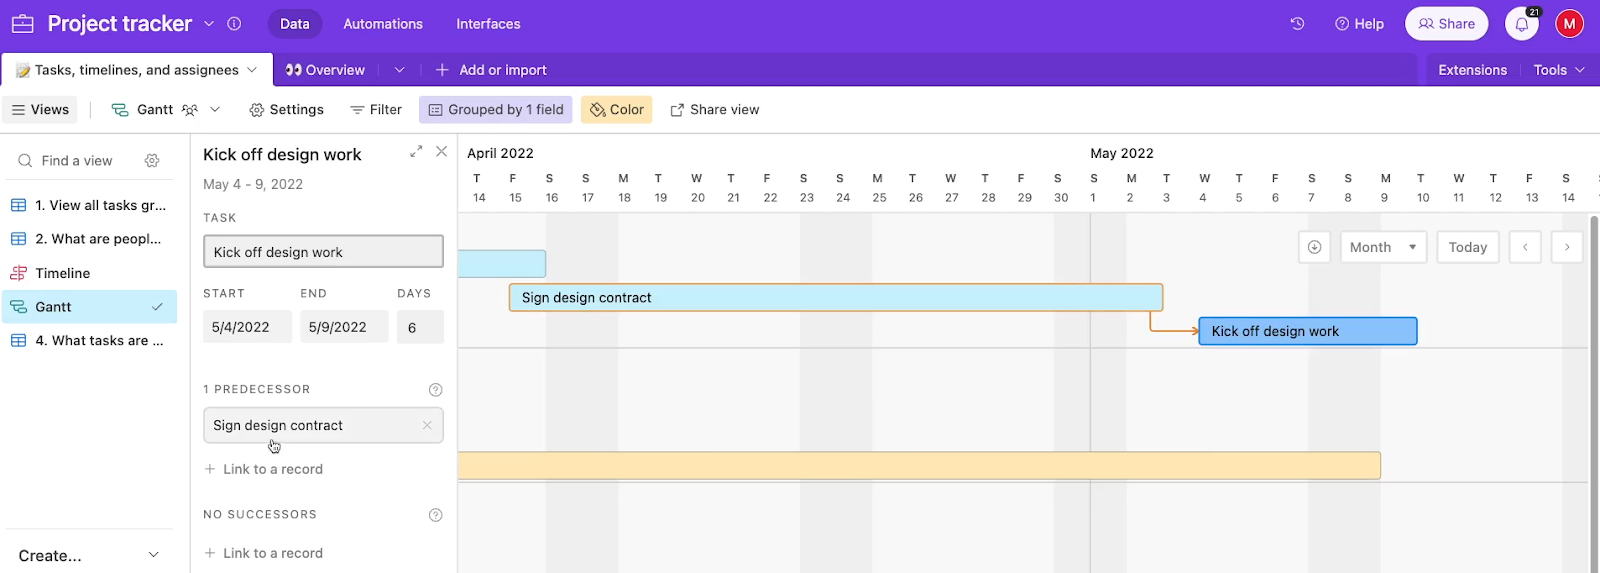
Because of the dependencies, this view is useful for more granular project management and scheduling compared to a “Timeline” view.
Gantt views and Timeline views both require a Pro account.
NOTE: to use Timeline and Gantt views correctly, each record will need to have at least two date fields that can be mapped to “Start date” and “End date”.
A calendar view is a view that displays records as events on a calendar, and allows you to filter by date range and other criteria.

Calendar views are ideal for scheduling and planning, and can be a great way to make a content calendar or high-level schedule.
A gallery view is a view that displays records as cards in a gallery, and allows you to customize the card layout and fields displayed.
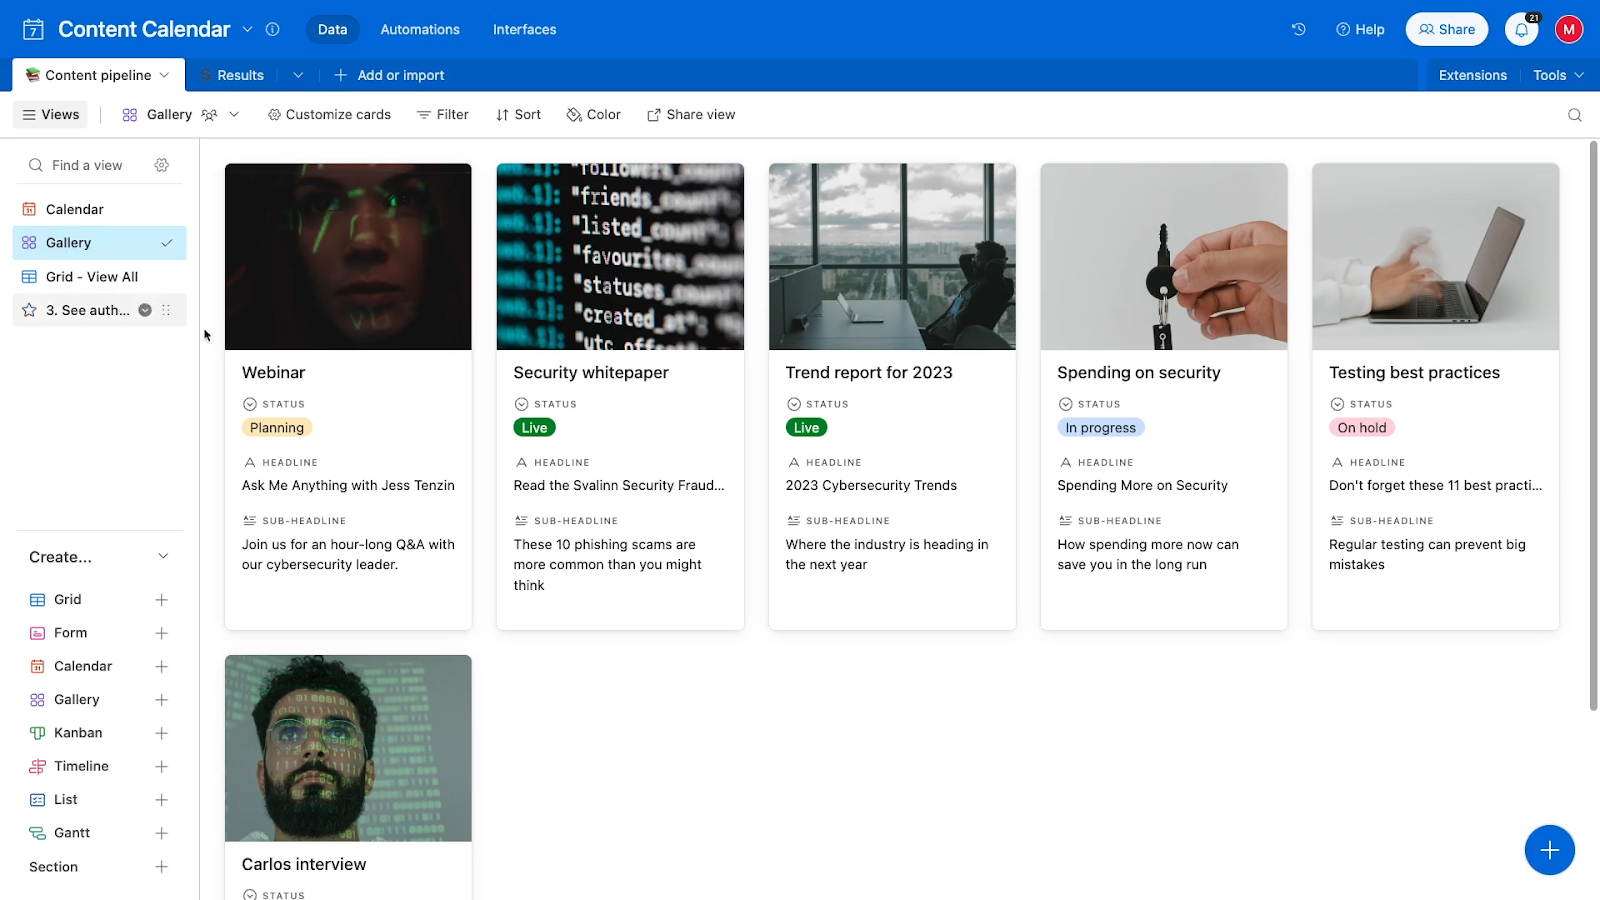
Using a gallery view lets you focus on an image attached to each record, and could be a great way to review design assets or media.
A list view is a view that displays records as a list, and allows you to customize which fields are displayed and in what order.
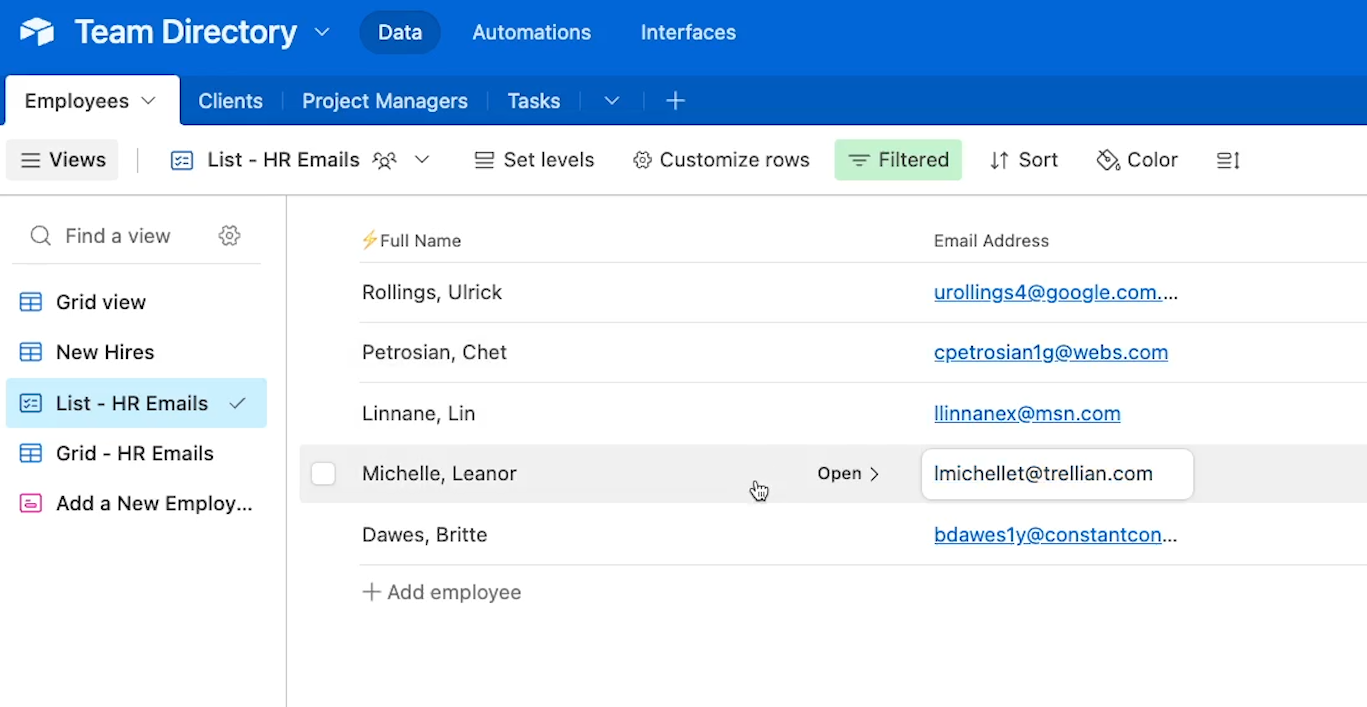
A list essentially looks and works like a simplified grid. Lists are a convenient way to just display a title and basic info for each entry instead of a long list of fields.
Of course, you could always just hide fields in a grid view, but list views feature a simpler UI which makes it easier for non-technical people to view a curated subset of a larger database.
Finally, a form view is a view that allows you to create a custom form for adding new records to your table.

Airtable forms are a great way to collect data from external sources and simplify data entry. They can also be a useful tool when you start building automations in your databases.
Many automations will trigger whenever a record enters a specific view, or whenever a record is added to a database. If you add the record directly into any other view type, an automation may trigger while you’re still populating fields, which could result in the automation trying to run with incomplete data.

With a form, a record isn’t created until you click “submit”, so you can ensure that all of the data you need is there before the record is added.
Each type of view is designed to serve a different purpose, so it's important to choose the right view for your specific needs.
Just make sure to always keep a simple grid view with all of your records displayed. Even though filters and views don’t delete any of your data, they can make it hard to find certain records or fields if you don’t have a convenient “view all” option.
Airtable is one of the best database apps available for building no-code and low-code workflow automations.
The granular control afforded by filters and views makes it easy to choose when your automations run, and which records they process.
You can easily set up an automation to run whenever a new record is added to a specific view, so essentially, you can prompt an automation to run based on any data that’s available to you in Airtable.
Many automations can even be built directly in Airtable, although third-party providers like Zapier and Make will definitely give you a more extensive list of integrations with other software you already use.
To give you an idea of how Airtable automation works, I’ll show you how to build a simple automation using Airtable’s native automation tools.
First, here’s a brief overview of how to build an automation in Airtable in a few quick steps:
1. Click on the “Automations” tab at the top of your base.
2. Click “Create automation” in the bottom left hand menu.
3. Choose a trigger, such as “When a record enters a view”.
4. Configure your trigger. For instance, you may need to identify the base and table you want to watch.
5. Add an automated action. Choose an Airtable action, or an integration with another app.
6. Authorize the integrated app, if required.
7. Configure your automated action. Include dynamic data from Airtable when applicable.
8. Click on “Test automation” to run a test.
9. Once your automation is performing correctly, turn it on, give it a name, and save the URL to the related view.
Now let’s explore those steps in more detail.
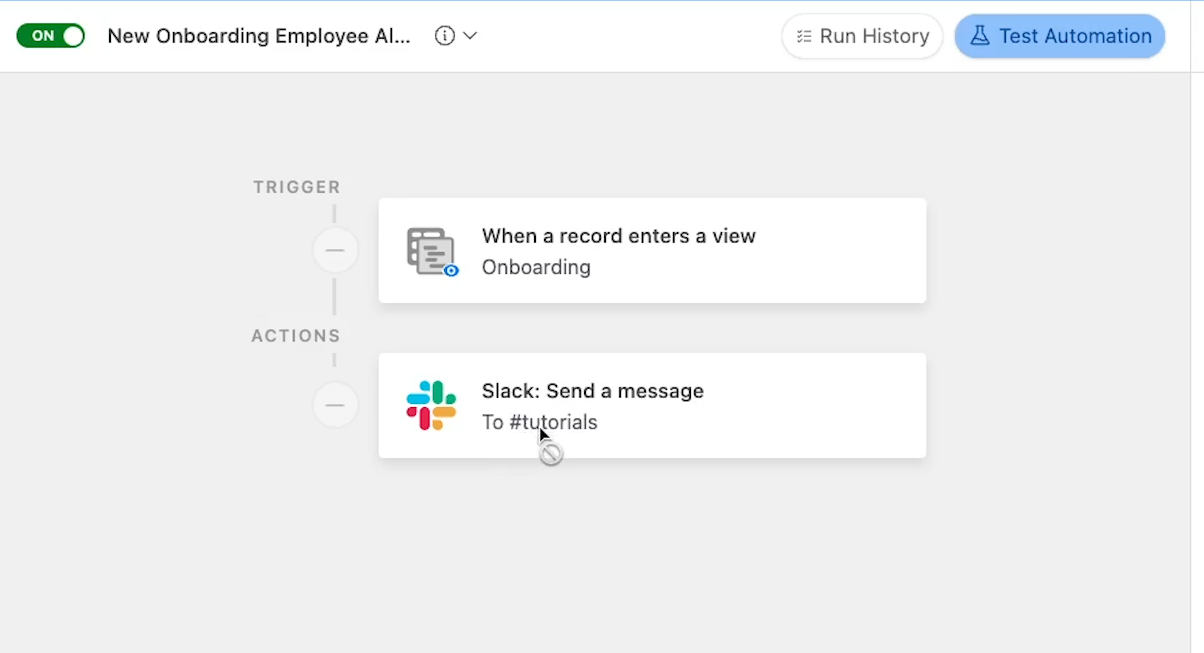
Every automation consists of a single trigger event that prompts the automation to run, and one or more automated actions that will occur whenever the trigger is activated.
For our example, we’re going to send an automated Slack message whenever a new hire is added to the “Onboarding” view.
The onboarding view has a filter so that it only shows employees with a ‘Status’ equal to ‘Onboarding’.
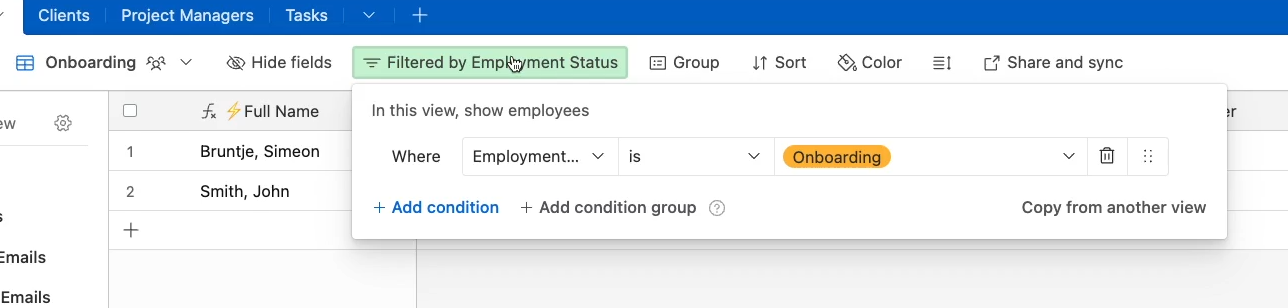
When you’re building an automation in Airtable, the easiest way to control when the automation runs is to pair your automation with a dedicated view like this.
To get started, just click on the "Automations" button in the toolbar, and select "Create automation".
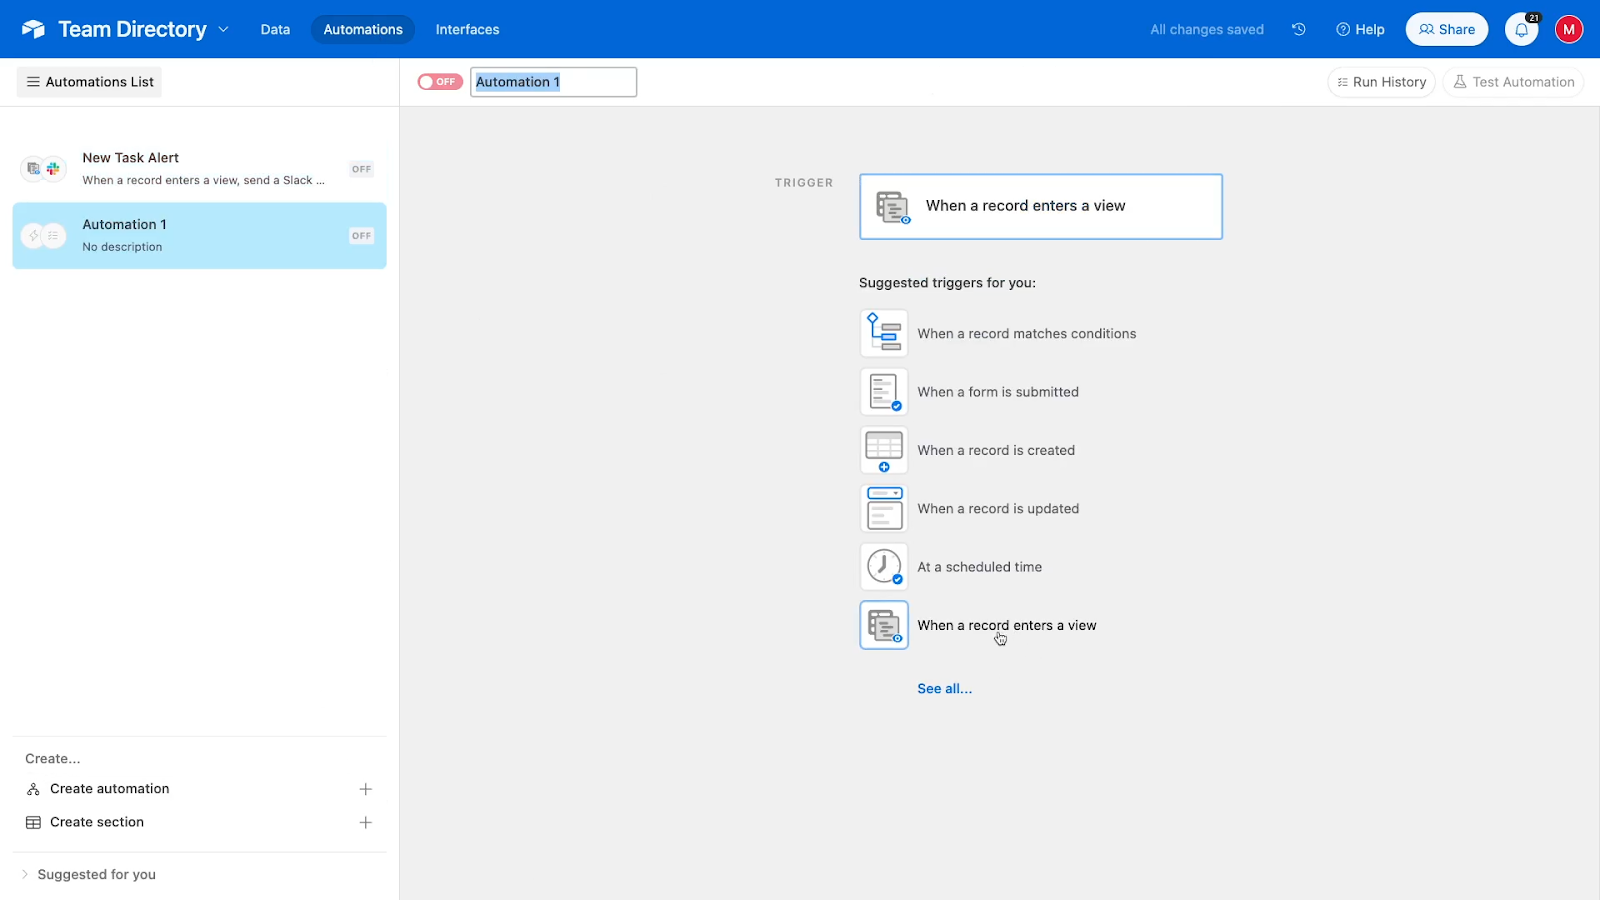
You’ll then see several options for your automation’s trigger. Choose “When a record enters a view.”
Then, we need to select the table and view that we want the automation to watch. We’ll choose the “Employees” table, and the "Onboarding" view as the view we want to watch for new records.
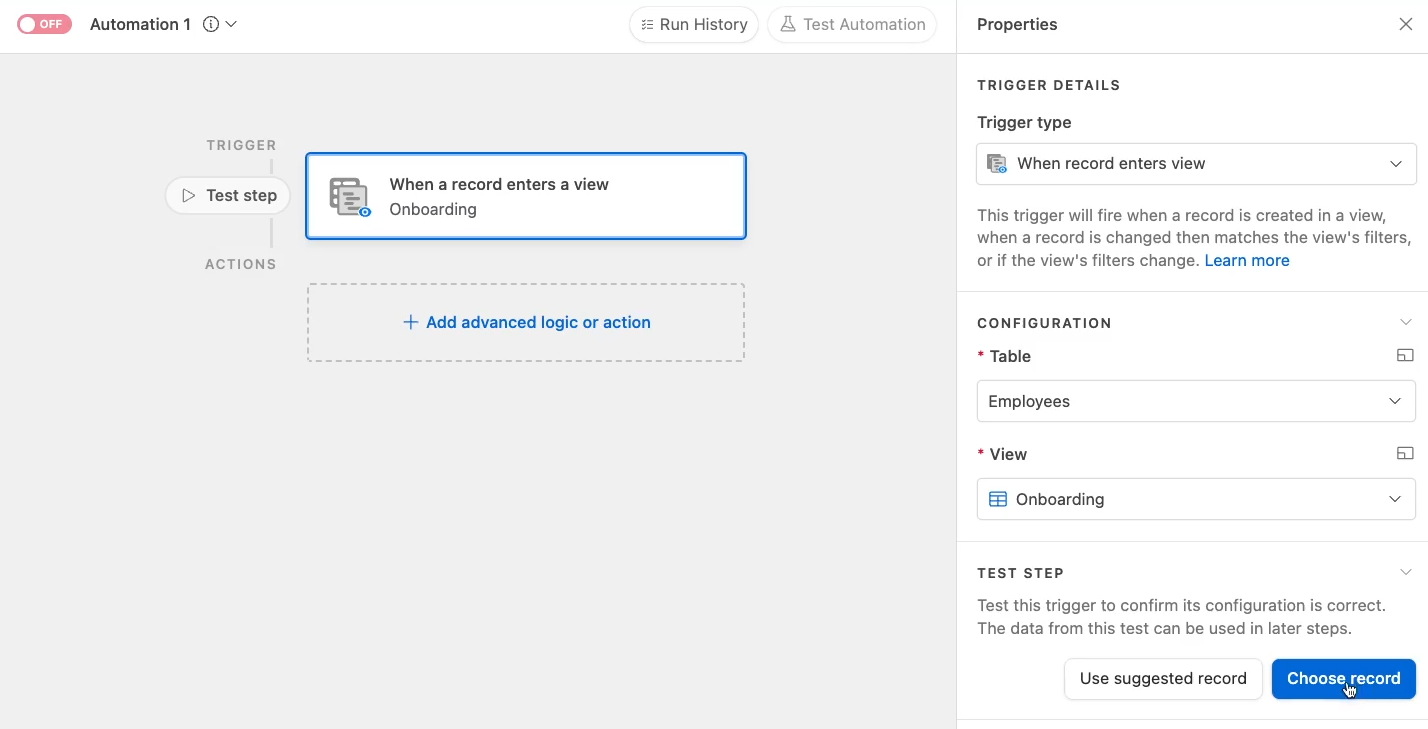
Then, under the “test step” section, click “Choose record” to pick a record that you can use to test the automation as you’re building it. You may want to add a dedicated “test” record with mock data to be safe.
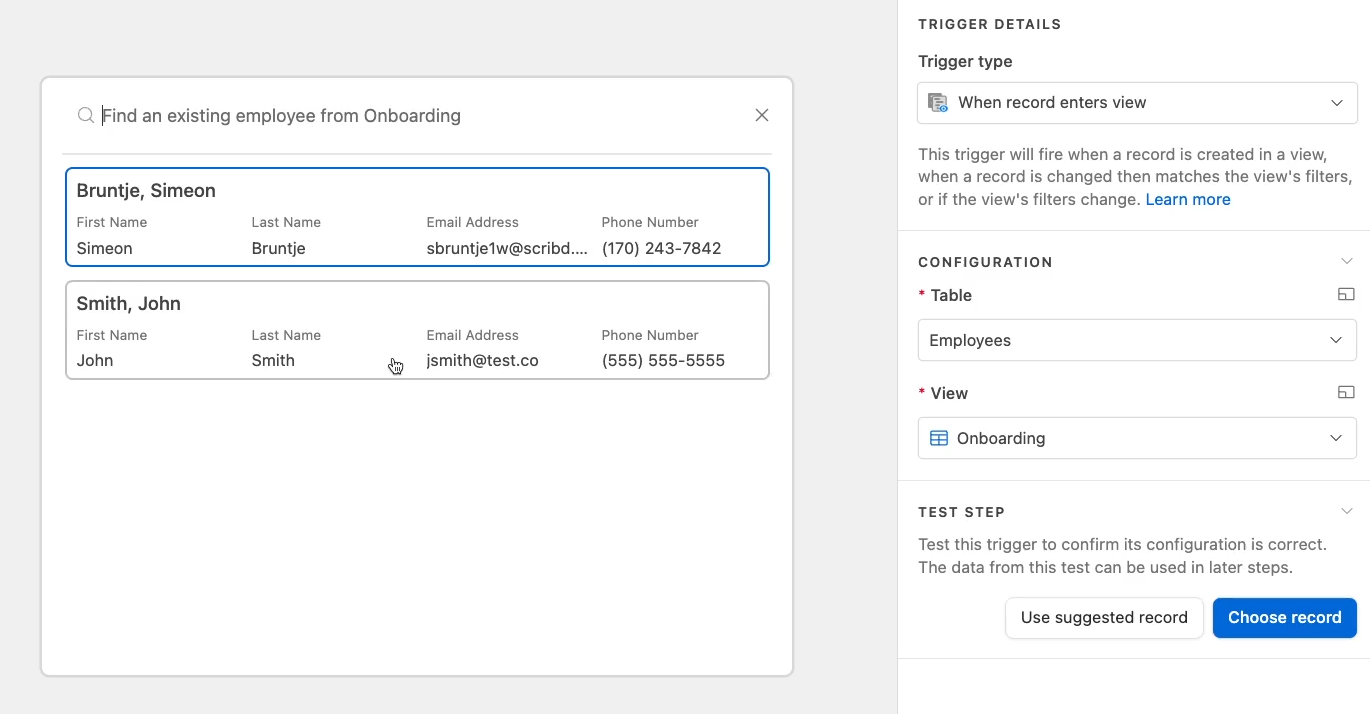
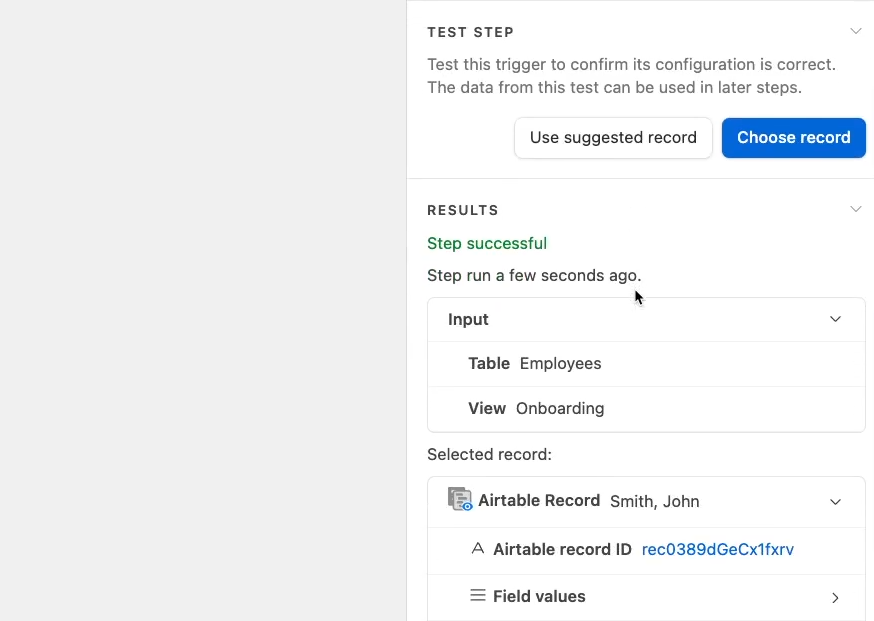
If the test was successful (i.e., if the trigger retrieved the record), you’ll see a small success message under the “Test Step” section.
With a successfully tested trigger, you can click the “Add advanced logic or action” button to add a Slack step.
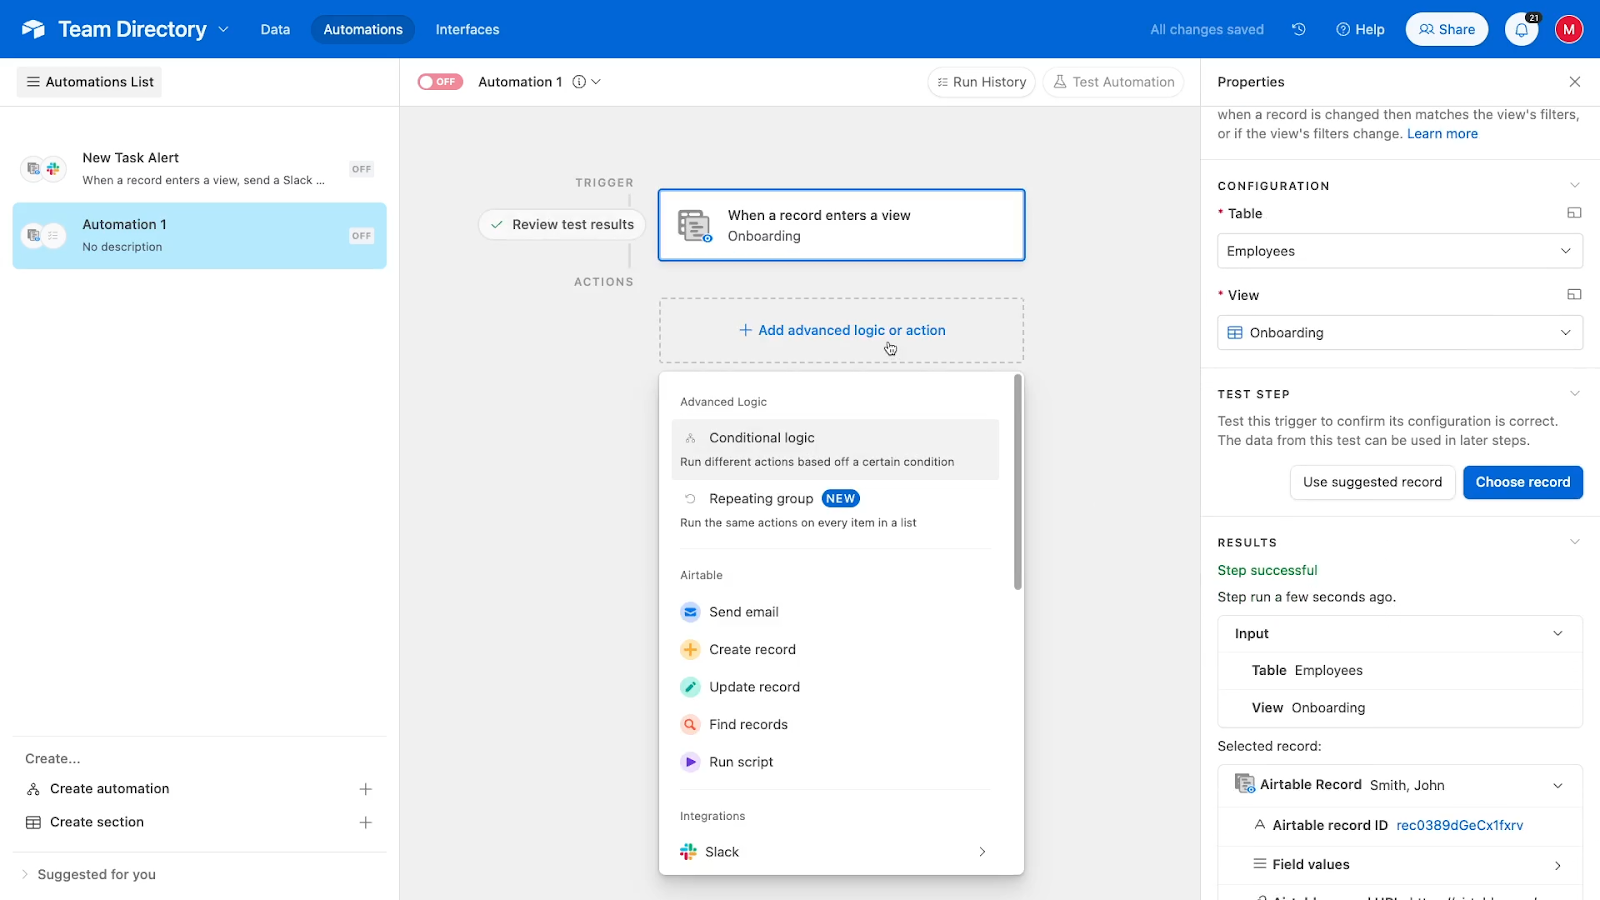
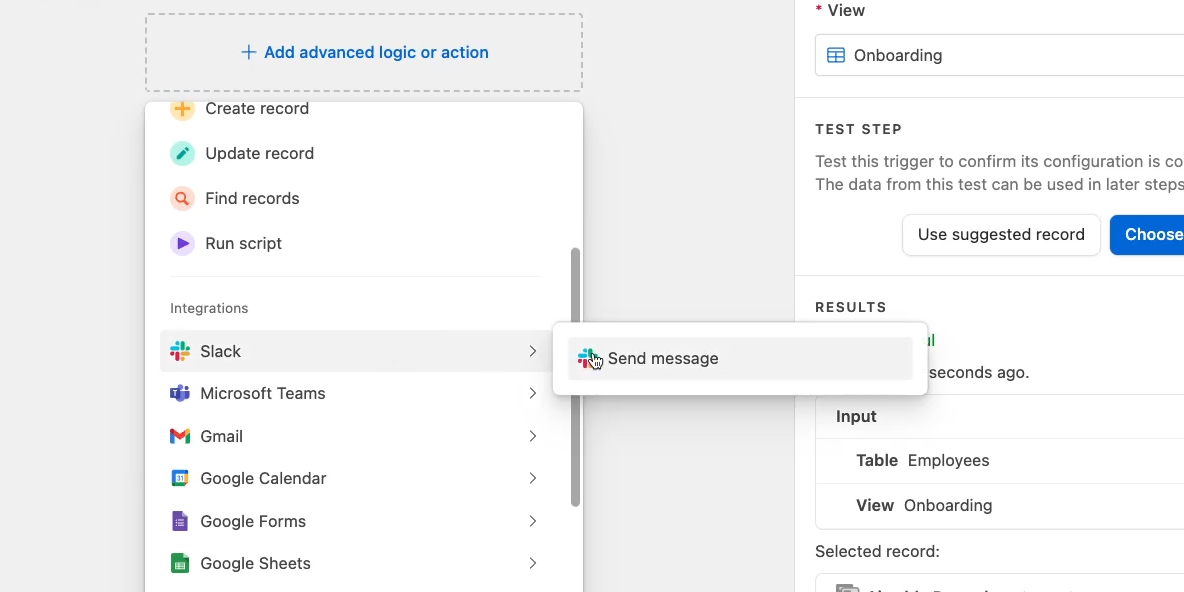
In the window that appears, scroll down to “integrations” to find the application you want to use. In our example, we’ll select ‘Slack’, and choose “Send message”.
When you’re using an Airtable automation to send data to other apps for the first time, you’ll always need to sign in to the relevant apps and authorize Airtable.
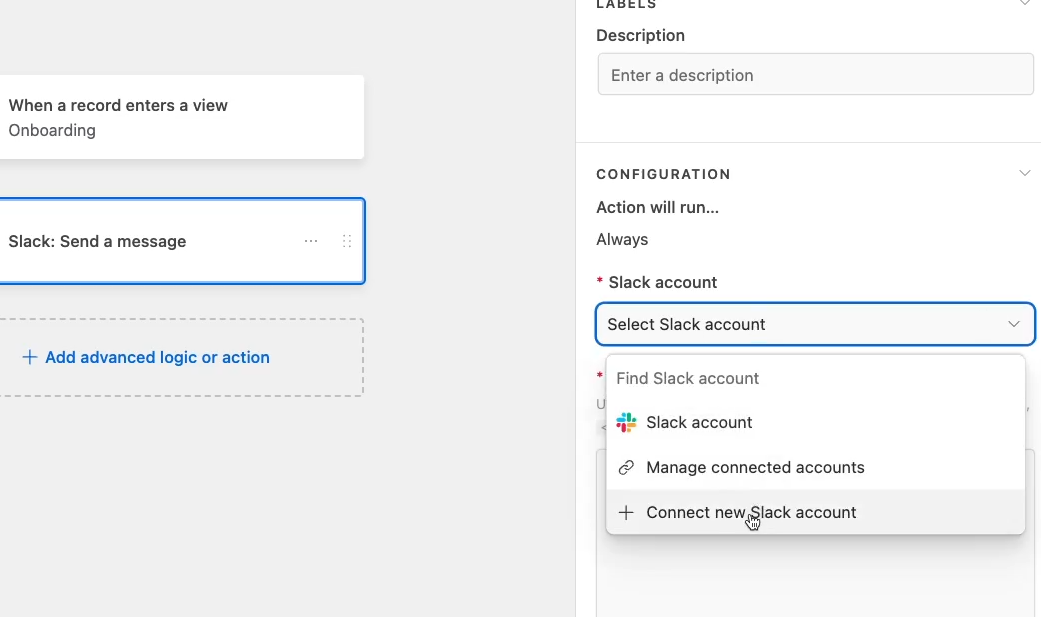
Click on “Select [app name] account”, and choose “Connect new [app name] account”.
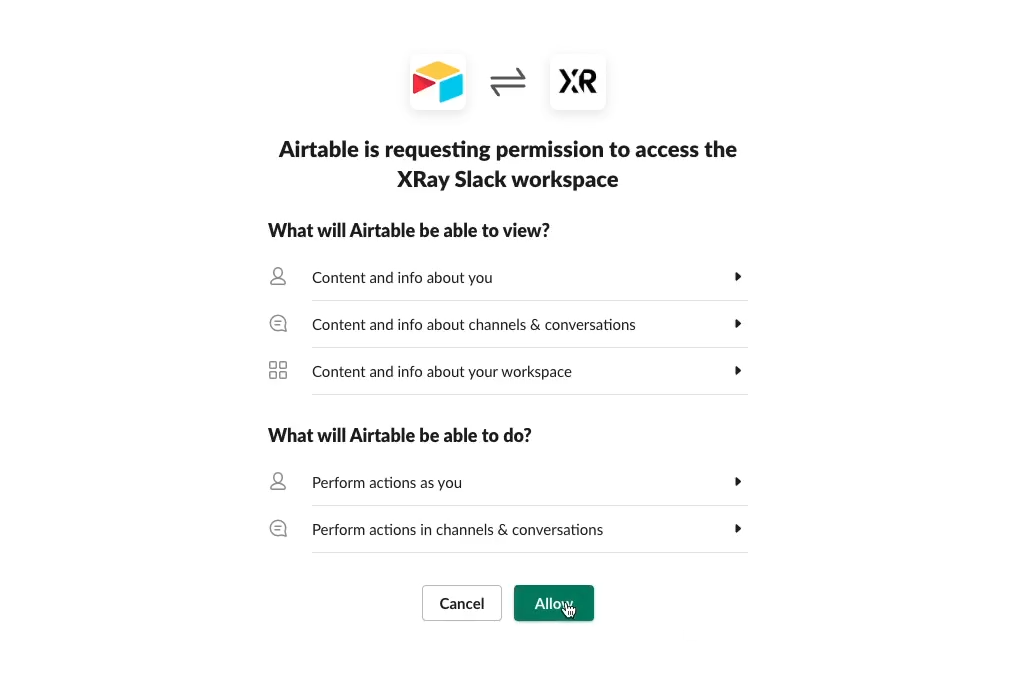
Review Airtable’s required permissions and click “Allow” to continue.
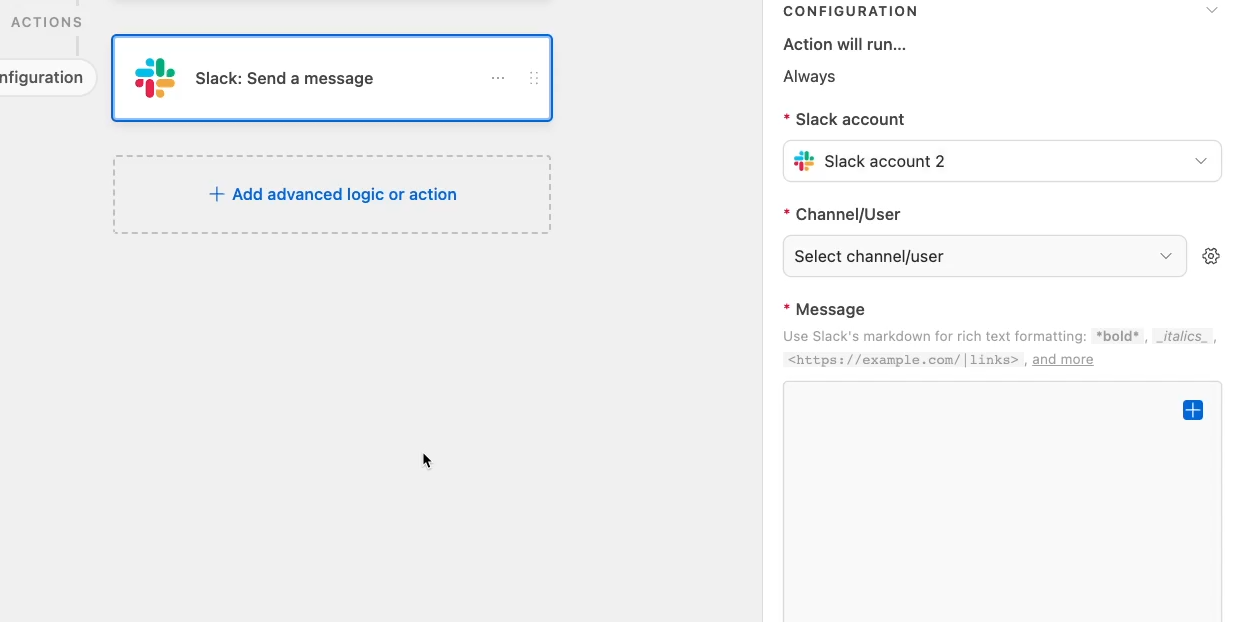
Now, you can configure the new action. Any required fields will be marked with a red asterisk.
In our Slack example, we need to provide the message that we want to send, and the user or channel that we want to send the message to.
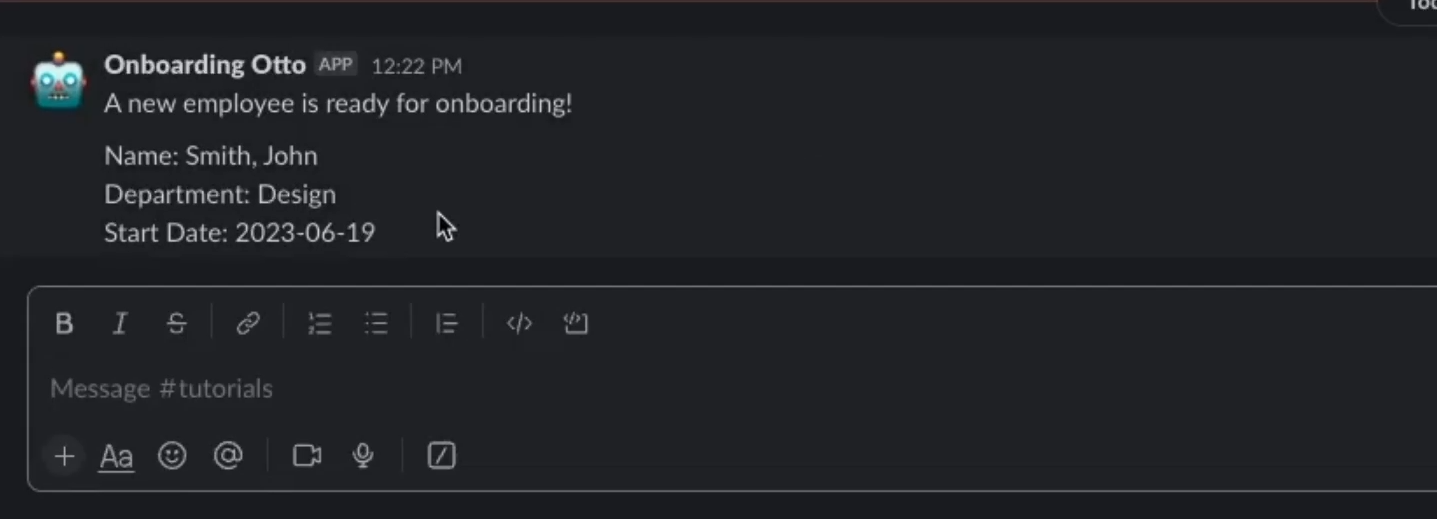
We’ll send the message to our “Tutorials” channel, and add a message that provides some basic information about the employee.
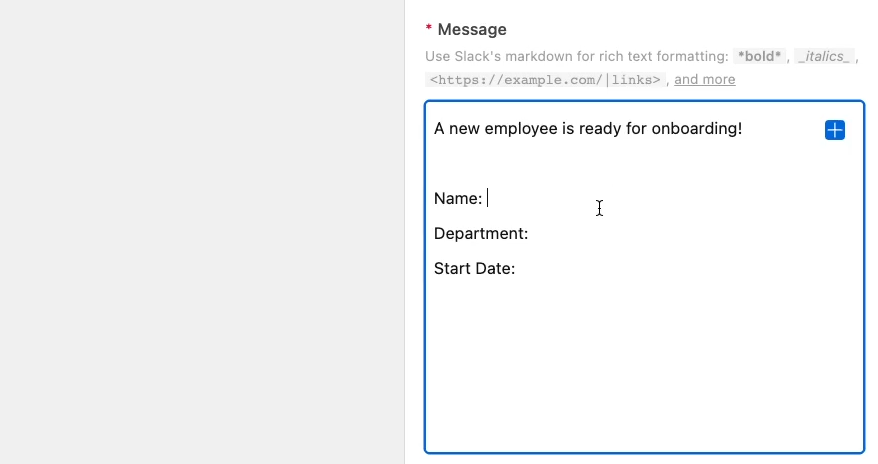
Any text that you enter directly into the “Message” field (or similar fields for other apps) will be used exactly as written every time the automation runs.
If you want to include dynamic data retrieved from the record that triggered the automation, you’ll need to click on the blue plus sign to access data from the trigger (or earlier actions).
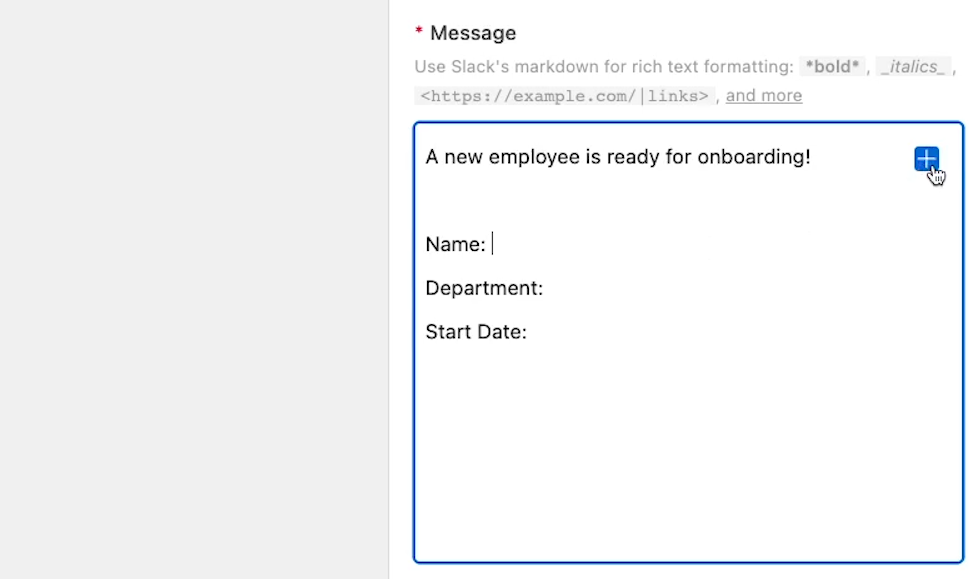
In our example, we can directly enter the initial message (“A new employee is ready for onboarding!”), as well as the labels for the employee’s information. However, we’ll need to access data retrieved in the trigger to include the employee’s actual name, department, and start date.

The remaining fields are optional, but we’ll go ahead and give our Slack bot a name and an emoji.
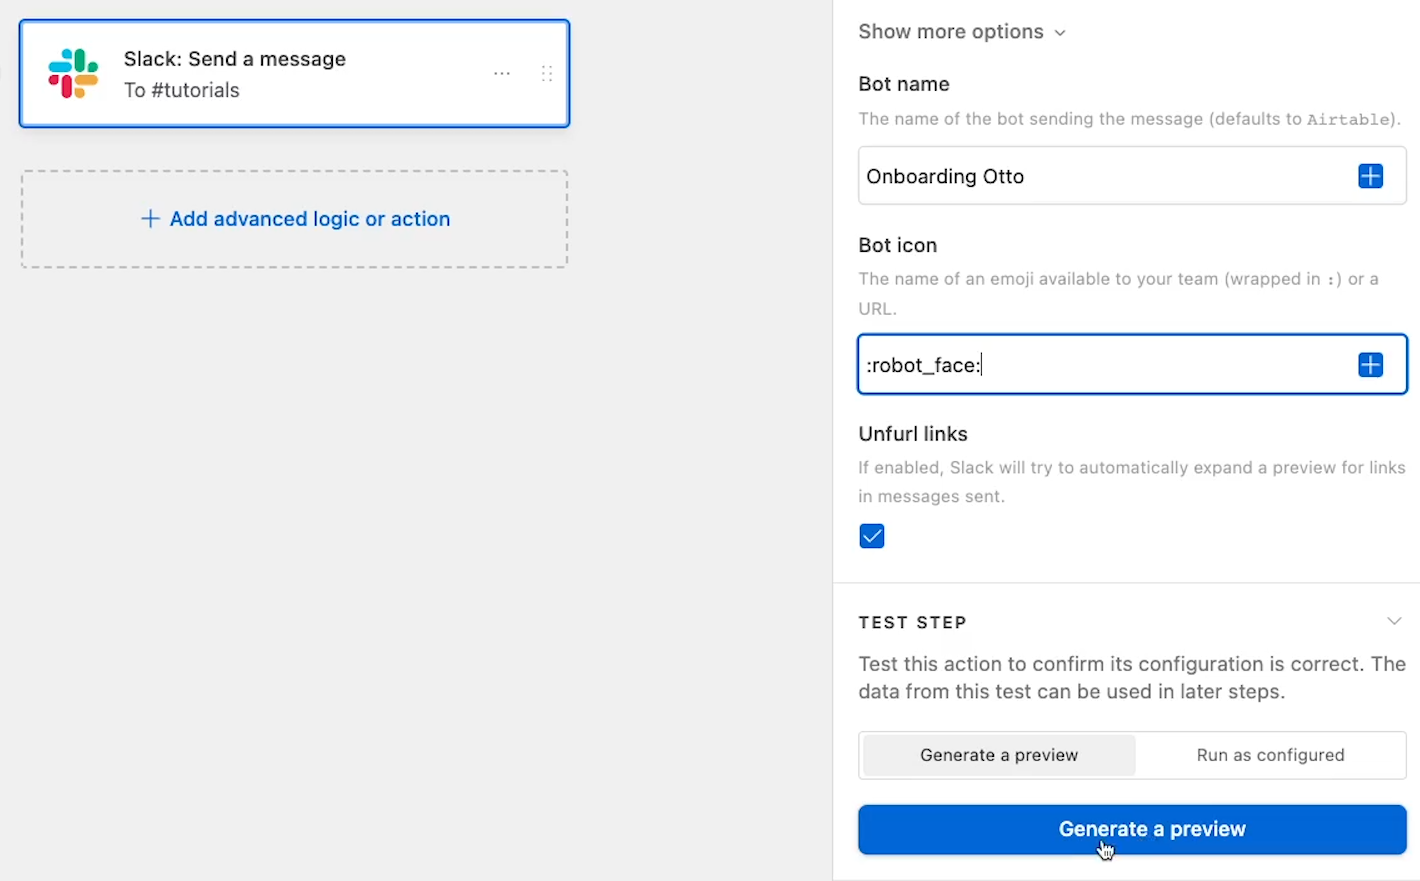
Once your action is fully configured, you can click on “Generate a preview”.
The preview will show you the content that your action will create (more or less), but won’t actually perform the action.

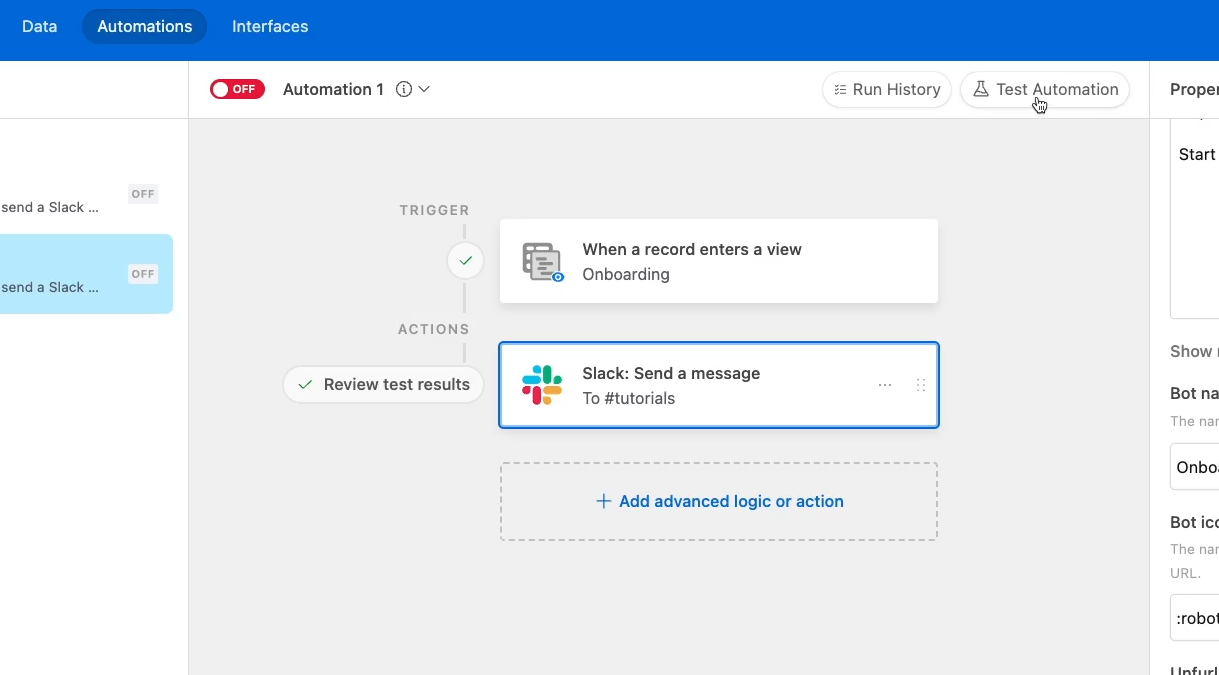
Even if everything in the preview looks good, it’s always a good idea to give the automation a real test just to be sure. Click on “Test automation”.
Then, select a record and click ‘Run automation’.
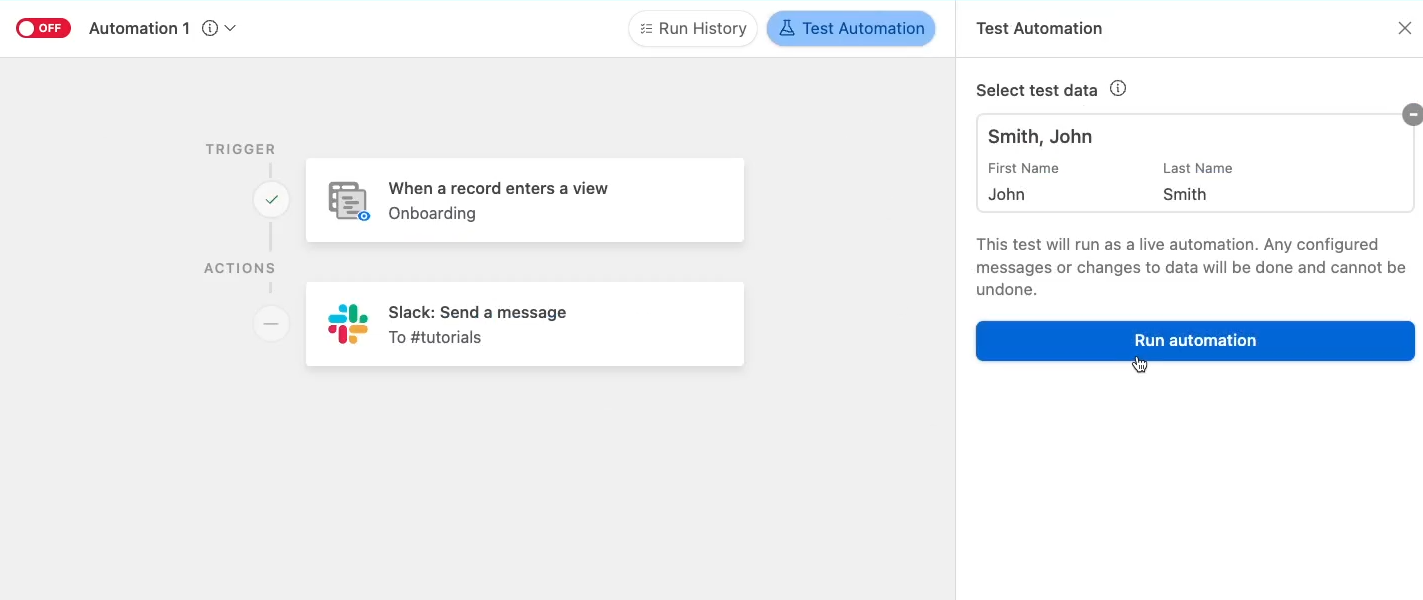
The action you configured should now run with your chosen record. In our example, we got a Slack message, exactly as we configured it in the automation.
Once you’ve got a successful test, you can turn your automation on and give it a descriptive name.
Once your automation is on, it will run whenever the trigger condition is met.
At this time, it’s also a good idea to copy the URL of the automation itself and copy it to the description of the related view.
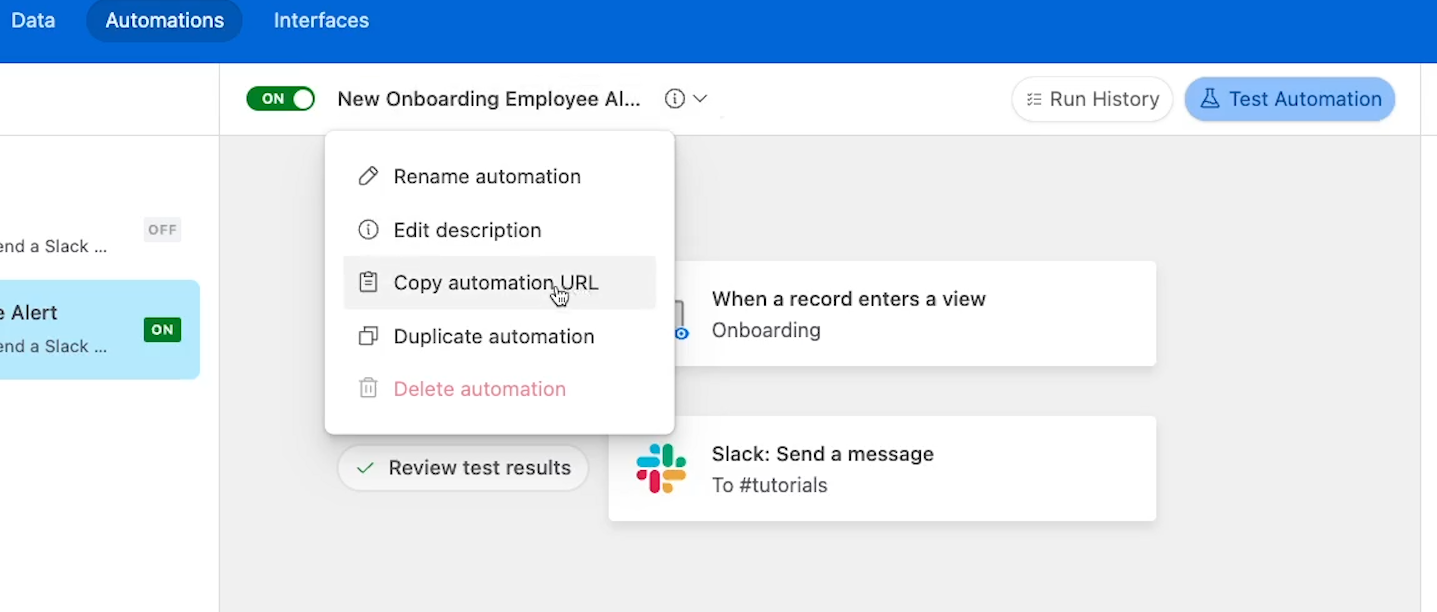
That way, you’ll always know that the “Onboarding” view, for instance, is connected to this specific automation.
Overall, Airtable's automation features make it easy to automate repetitive tasks and streamline your workflow, saving you time and effort in the long run.
With a little bit of planning and experimentation, you can create powerful automations that help you get more done with less effort.
This is just the beginning of what you can do with automations in airtable. There is full support for API calls, custom javascript, and more that can help even the most sophisticated product and tech teams to stay connected with external databases and apps.
For more complicated automations, or automations that use apps not supported by Airtable, you can use third-party providers like Zapier or Make.
Zapier and Make support thousands of popular web apps, and offer extensive options for building everything from simple two-step automations to sophisticated workflows with loops and branching paths.
If you’re a no-code builder, Airtable is a great app to use as a centralized database that supports all of your automations across several different platforms.
You can use it to control when all your automations run, and to collect and process the data your automations create.
If you’d like to explore Airtable automation with third-party providers, we have tons of tutorials on our blog for both platforms, like our comprehensive Beginner’s Guide to Zapier.
You can also check out our automation search engine, XRAY.Tools, to quickly discover what you can automate with Airtable and the tools you already use.
But for this walkthrough, we’ll be sticking with what you can do in Airtable itself, so let’s finish up this beginner’s guide with a quick look at Airtable interfaces.
Let’s wrap up this Airtable deep dive with a quick look at interfaces.
Interfaces are a feature that lets you distill any table into a simple visual interface or dashboard. Interfaces can help you to create a visually engaging summary of your data, or build a simpler layout for your team to interact with.
While interfaces have much more aesthetic customization options than standard tables, they’re still not suited to creating customer-facing products.
In other words, if you want to build a website out of your Airtable data, you’ll need an app like Softr to create a polished, user-friendly UI.
You can learn more about Softr in this post about building a complete no-code product.
There’s a lot you can do with interfaces, and we won’t be able to cover it all in this post.
But to help you get started with Airtable’s interfaces, we’ll show you how you can build a simple Dashboard interface to get a visual summary of your tables.
To begin, just click on “Interfaces” in the toolbar next to “Automations”. Then, choose “Start building”.

Now, you can give your interface a name. We’ll call ours “Employee Dashboard”.
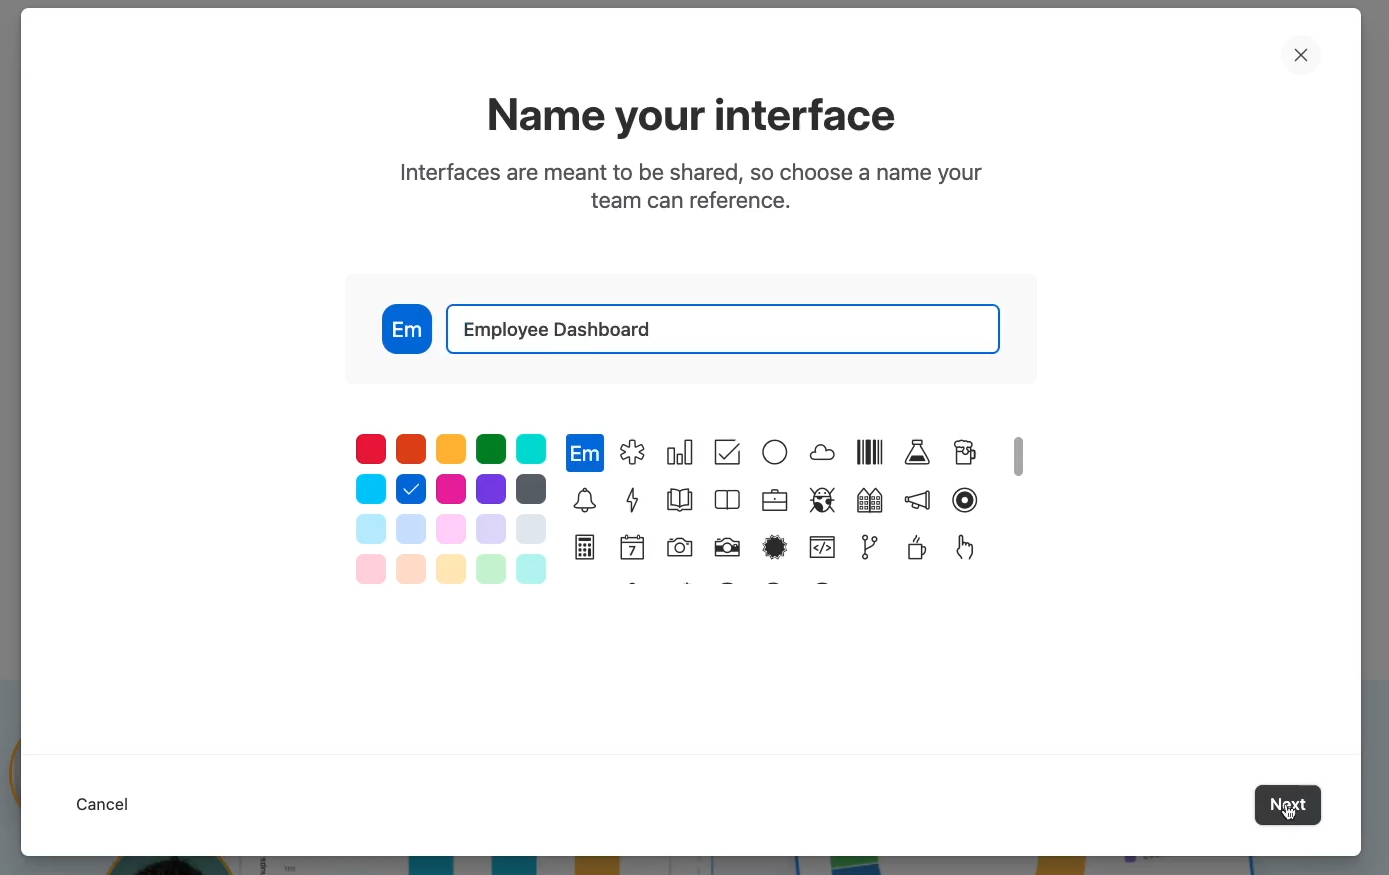
Next, you can choose a layout type to get started with for your first page. You can add several pages to your interface with different layouts, so feel free to experiment.
On the right, you’ll see a preview of your selected layout.
Most of the layouts are pretty similar to Airtable’s various view types, but one that’s a little more unique is the “Dashboard”, which is what we’ll select for our first page.
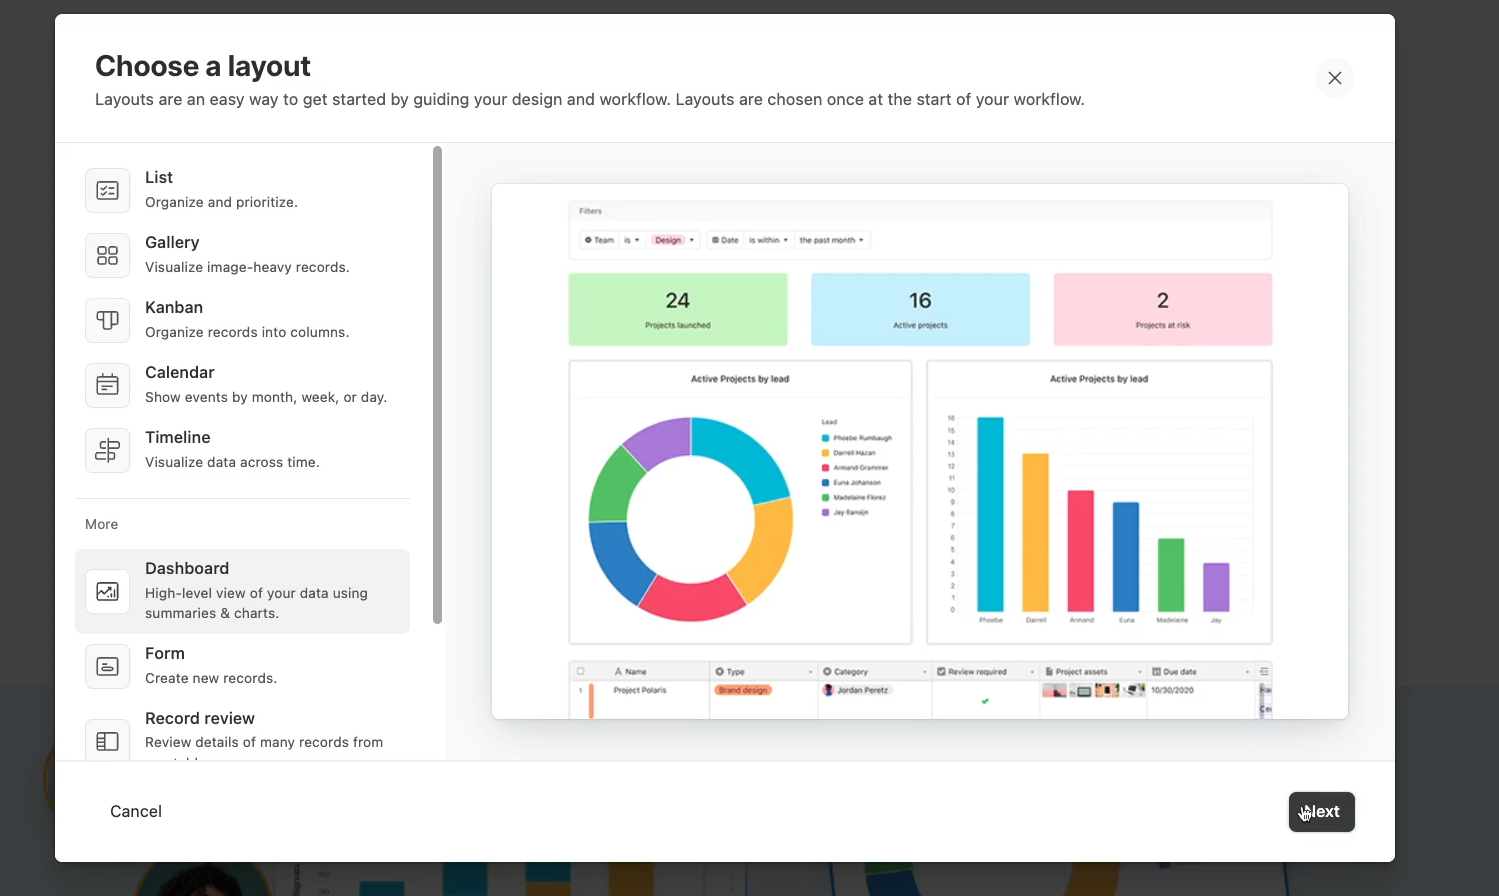
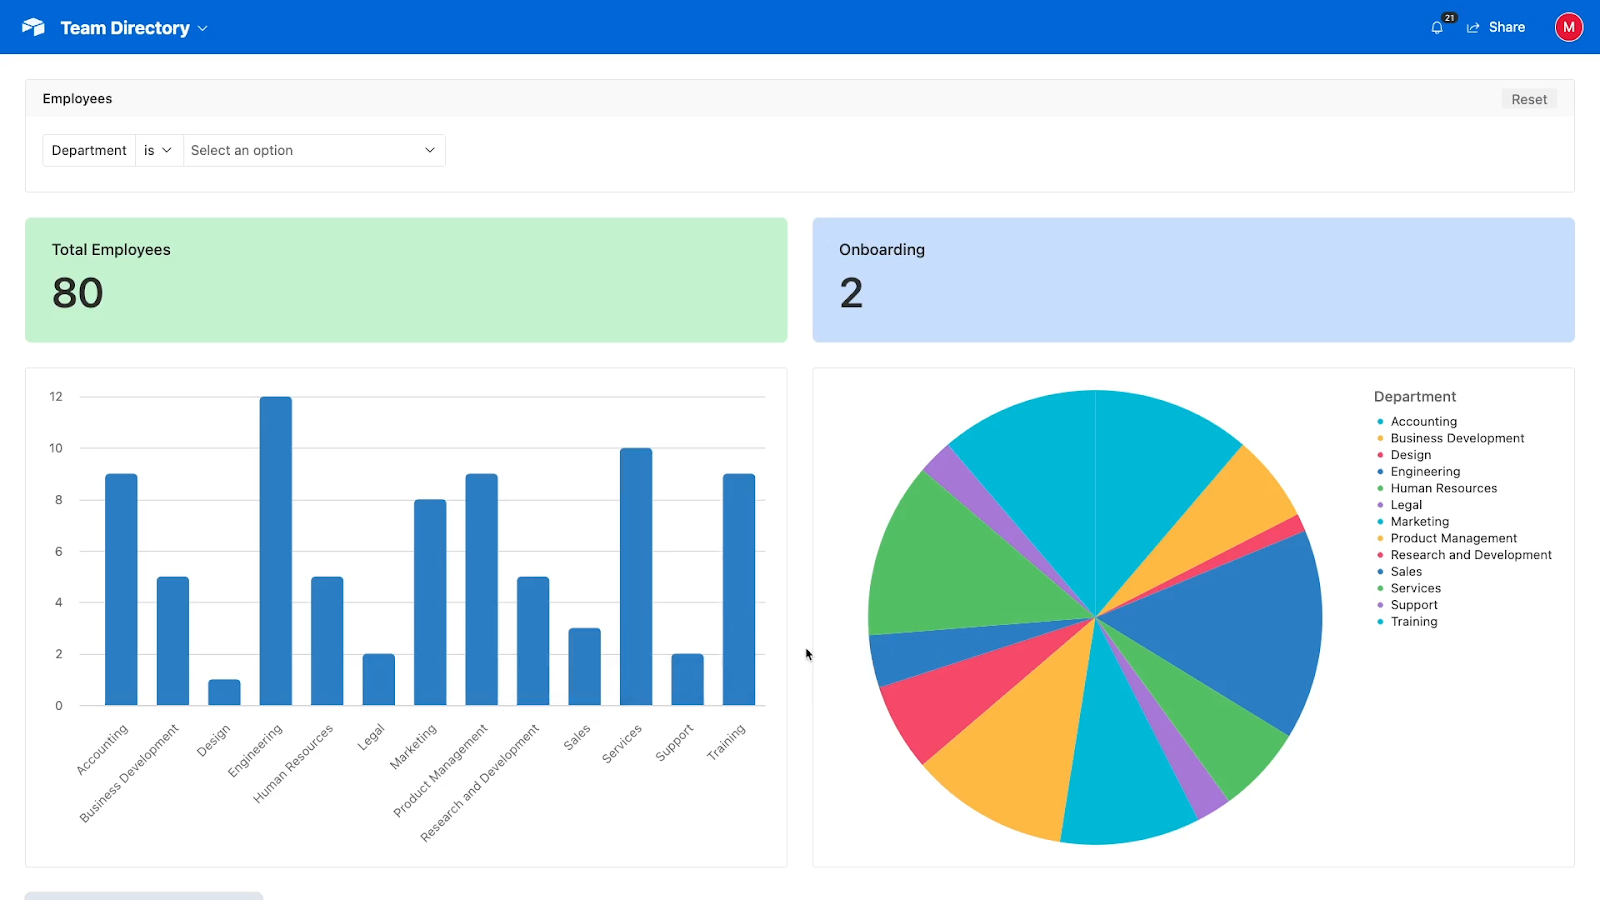
A dashboard displays statistics derived from your data, like the total number of records in a specific view or a table, and a visual breakdown of records based on specific fields.
Select the Dashboard layout, click “Next”, and pick a table that you want to use as a source for your dashboard. In our example, we’ll choose the “Employees” table we created earlier.

By default, the dashboard includes a filter, three high-level numbers, a bar chart, and a pie chart.
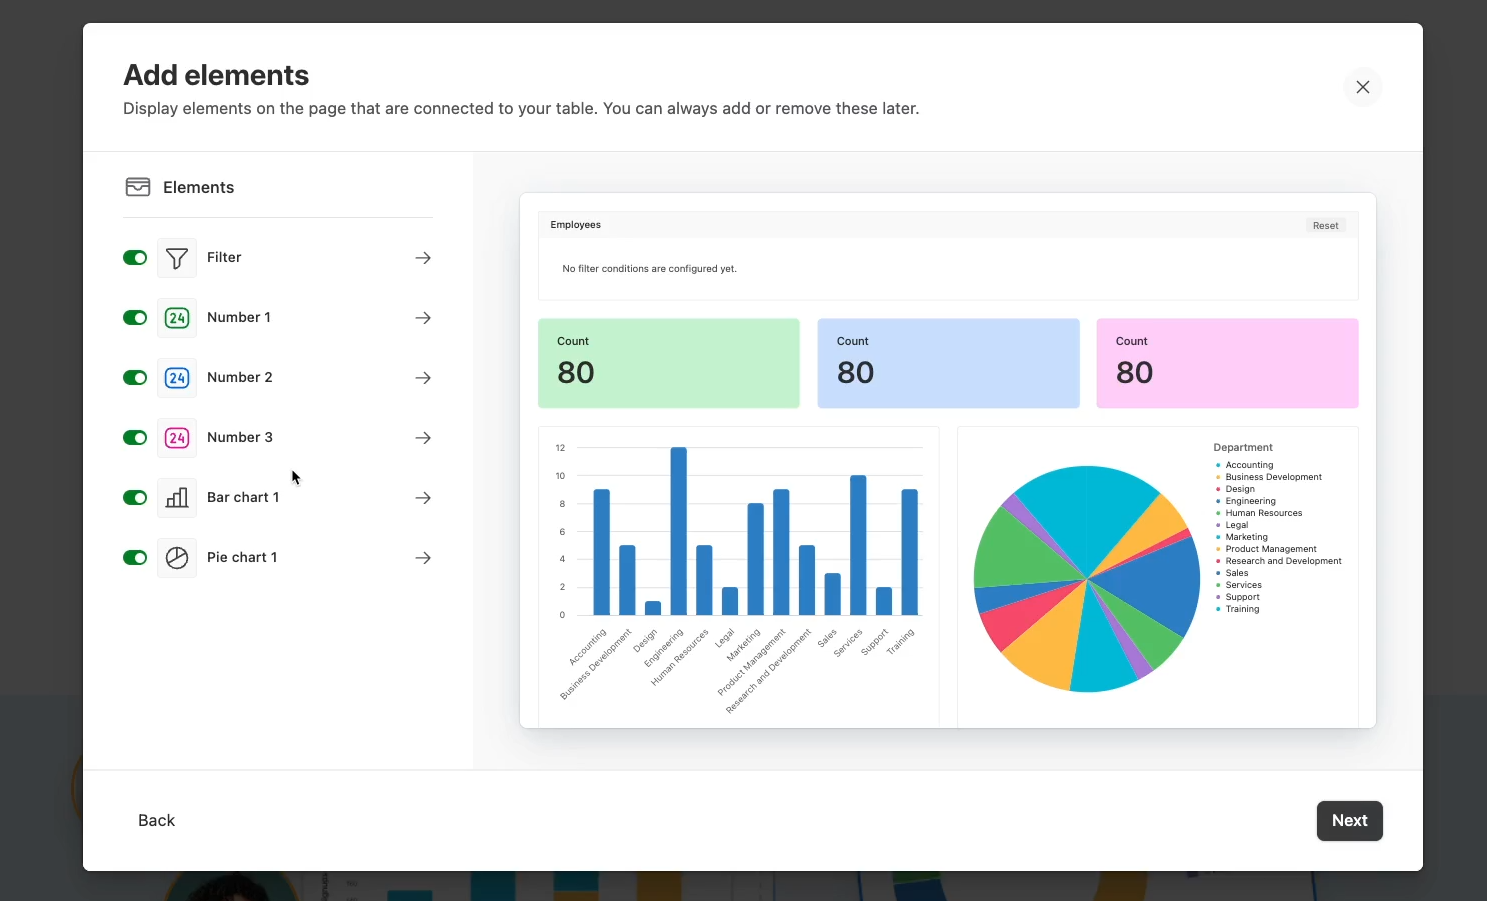
You could customize these figures a little bit on the “Add elements” screen, but you’ll have more granular control once the dashboard is created, so just click “Next” for now.

Then, give your page a name and click “Finish” to create your initial dashboard.
This first number with a green background is configured to count all records in the table, so we’ll update the label to reflect that.
Click on the element itself, then click on the “Appearance” tab in the right hand menu.
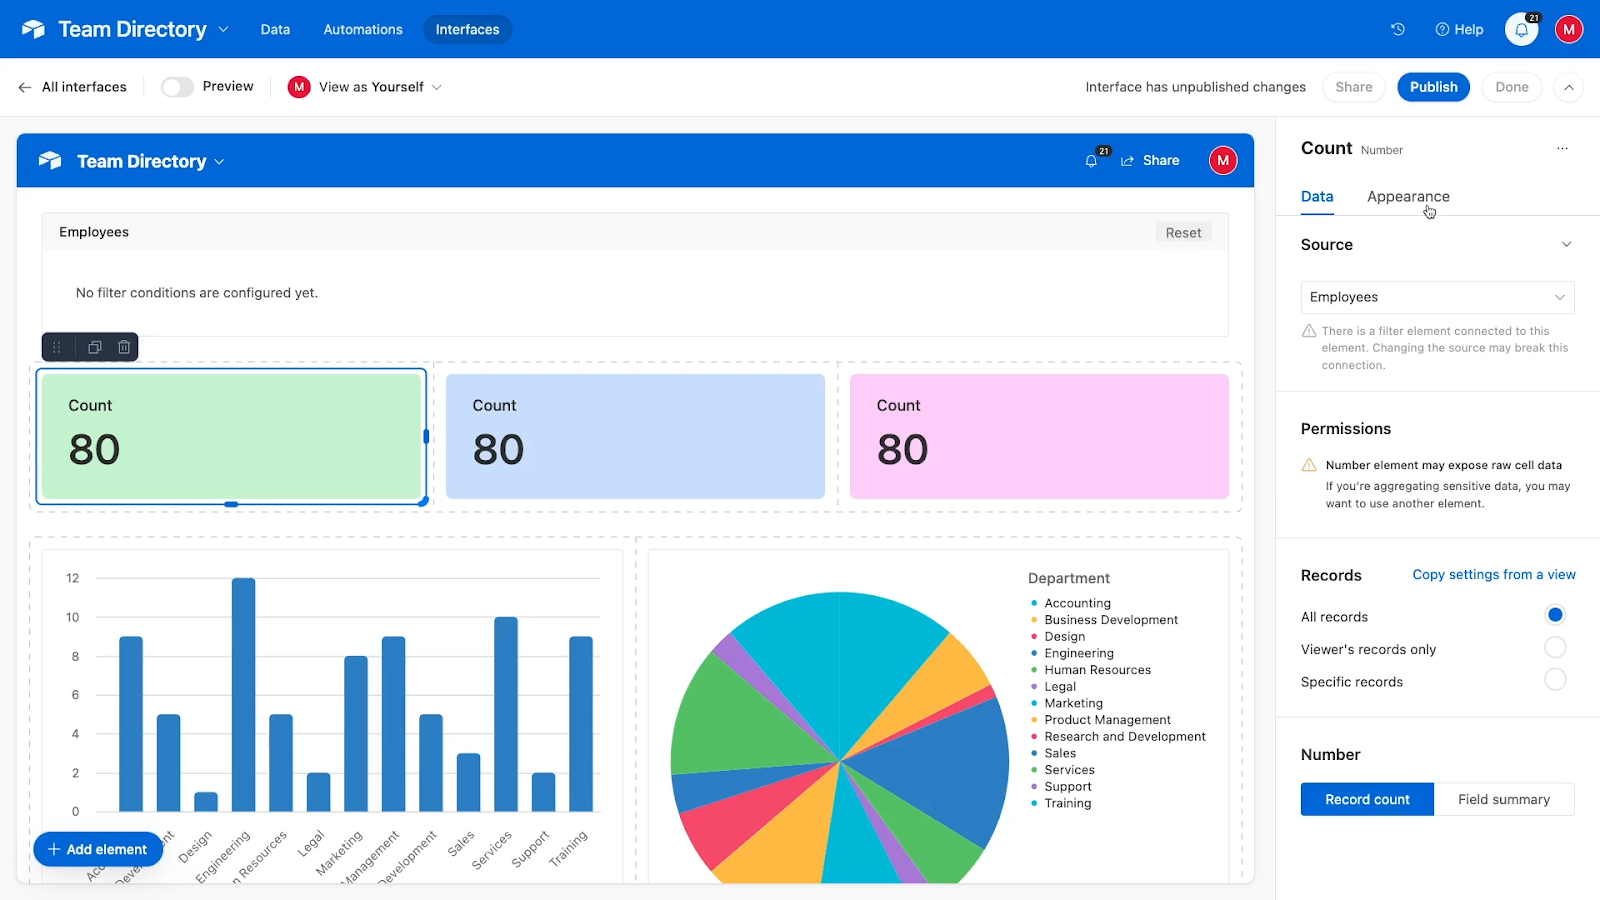
Then, enter a new title to replace “Count”.
The next two numbers are also just counting the total number of records. We don’t need to see that same number three times, so let’s update those.
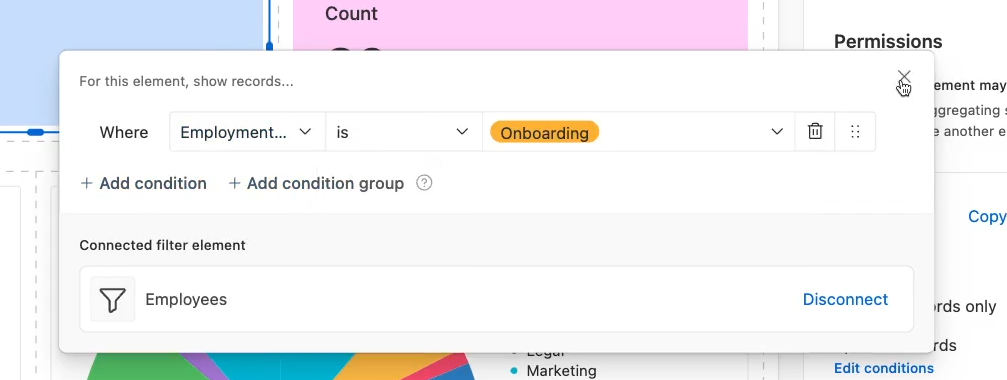
Select the second number, then under “records”, choose “Specific records” so that the element will only count records that match certain conditions.
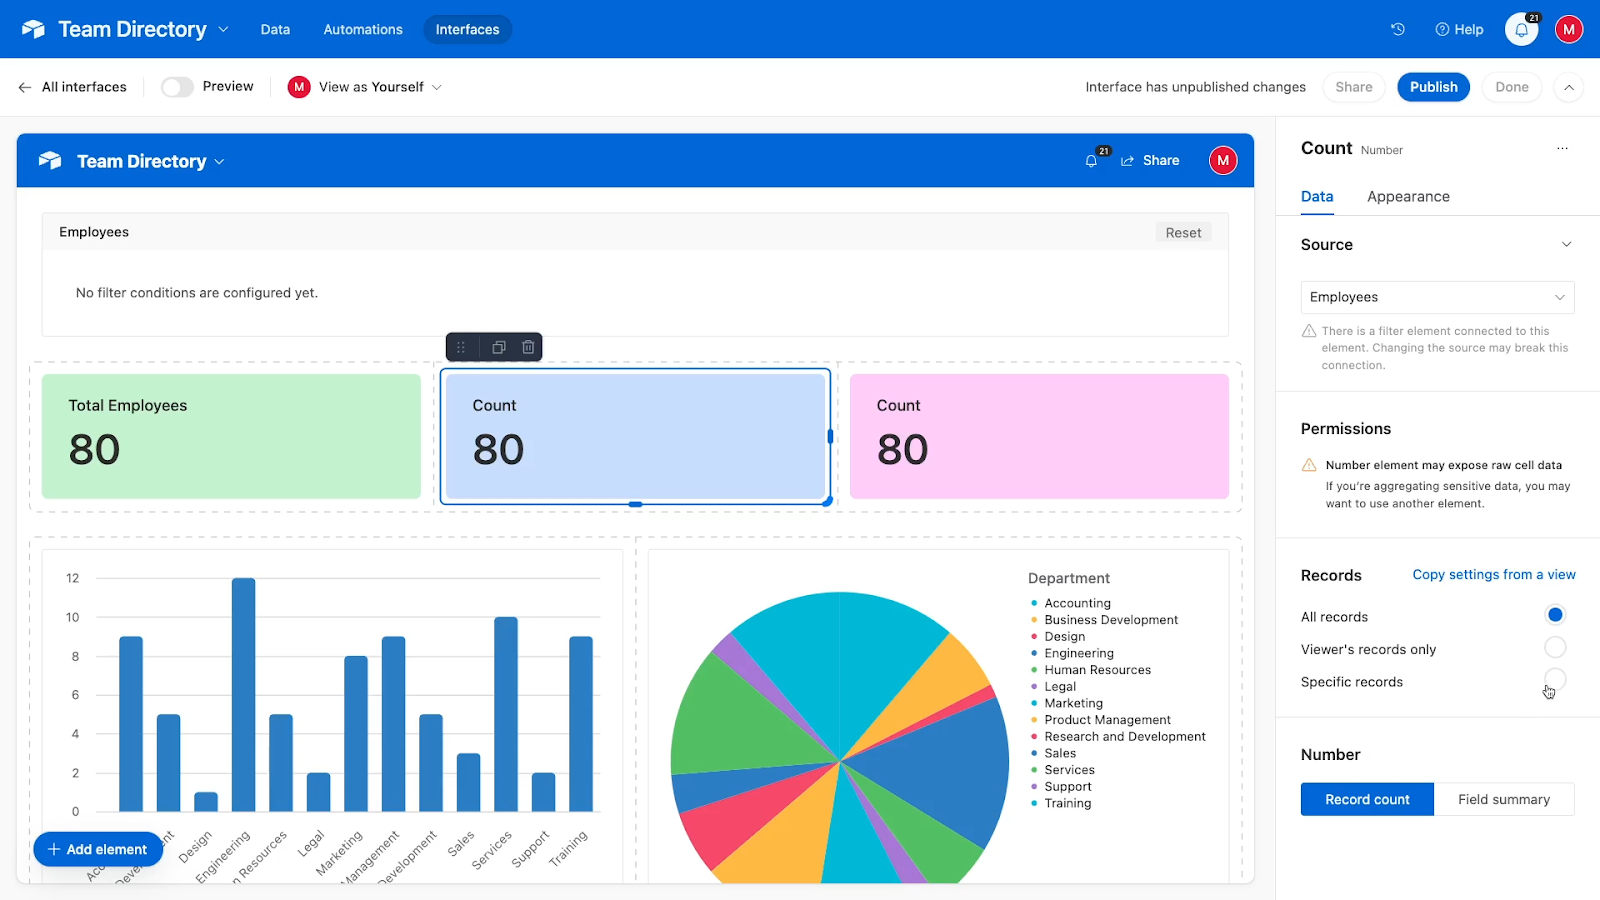
In our example, we’ll have this element count how many employees are marked as “Onboarding”.
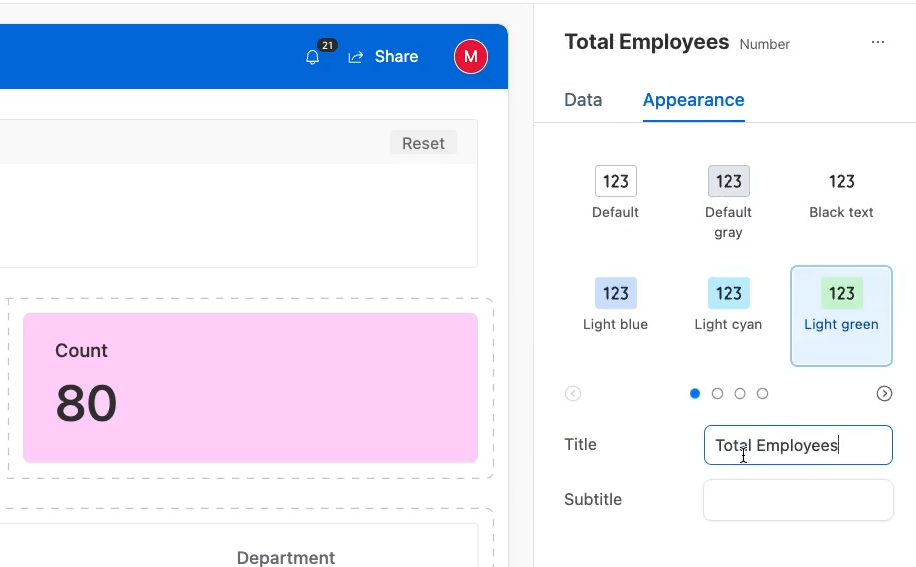
We can also change this element’s title just like we changed the first element’s.
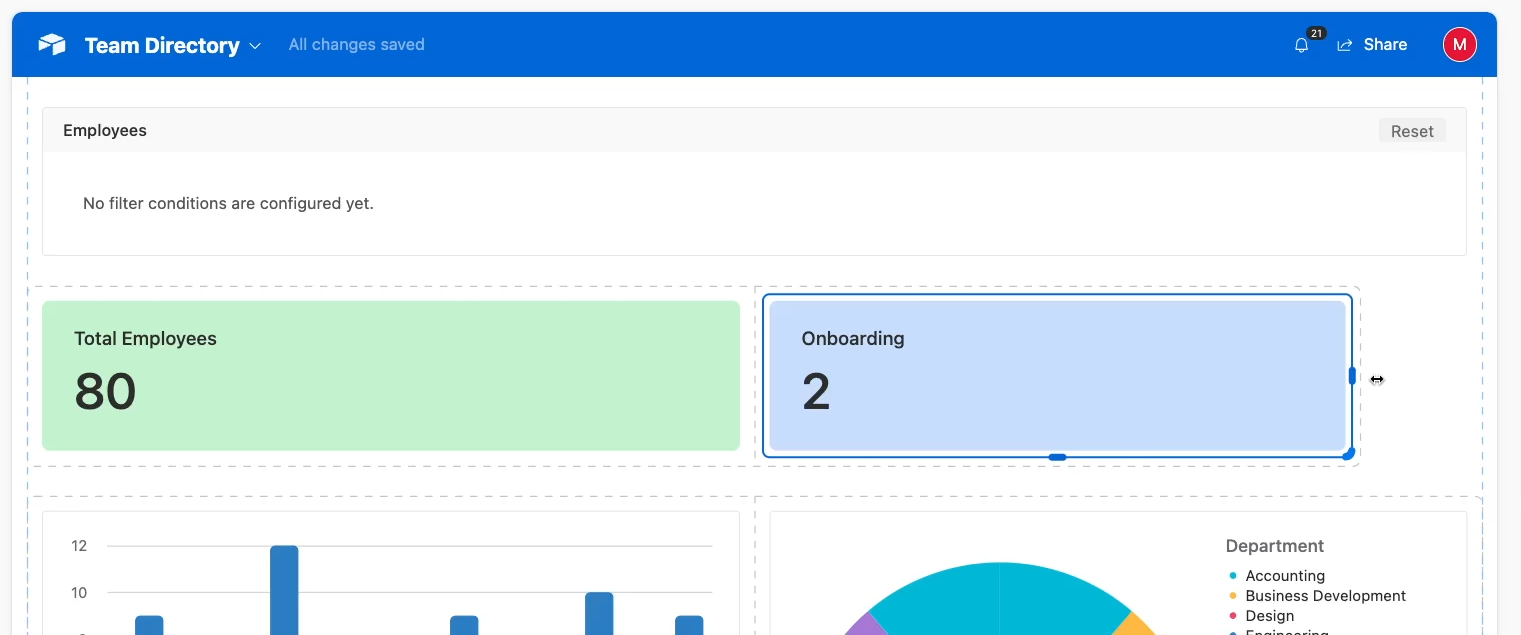
We only want these two numbers for now, so we’ll delete the third.
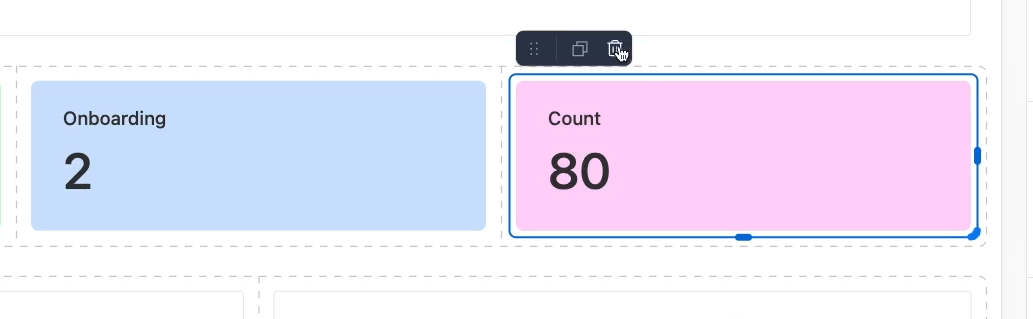
Then we can just drag the remaining elements to resize them.
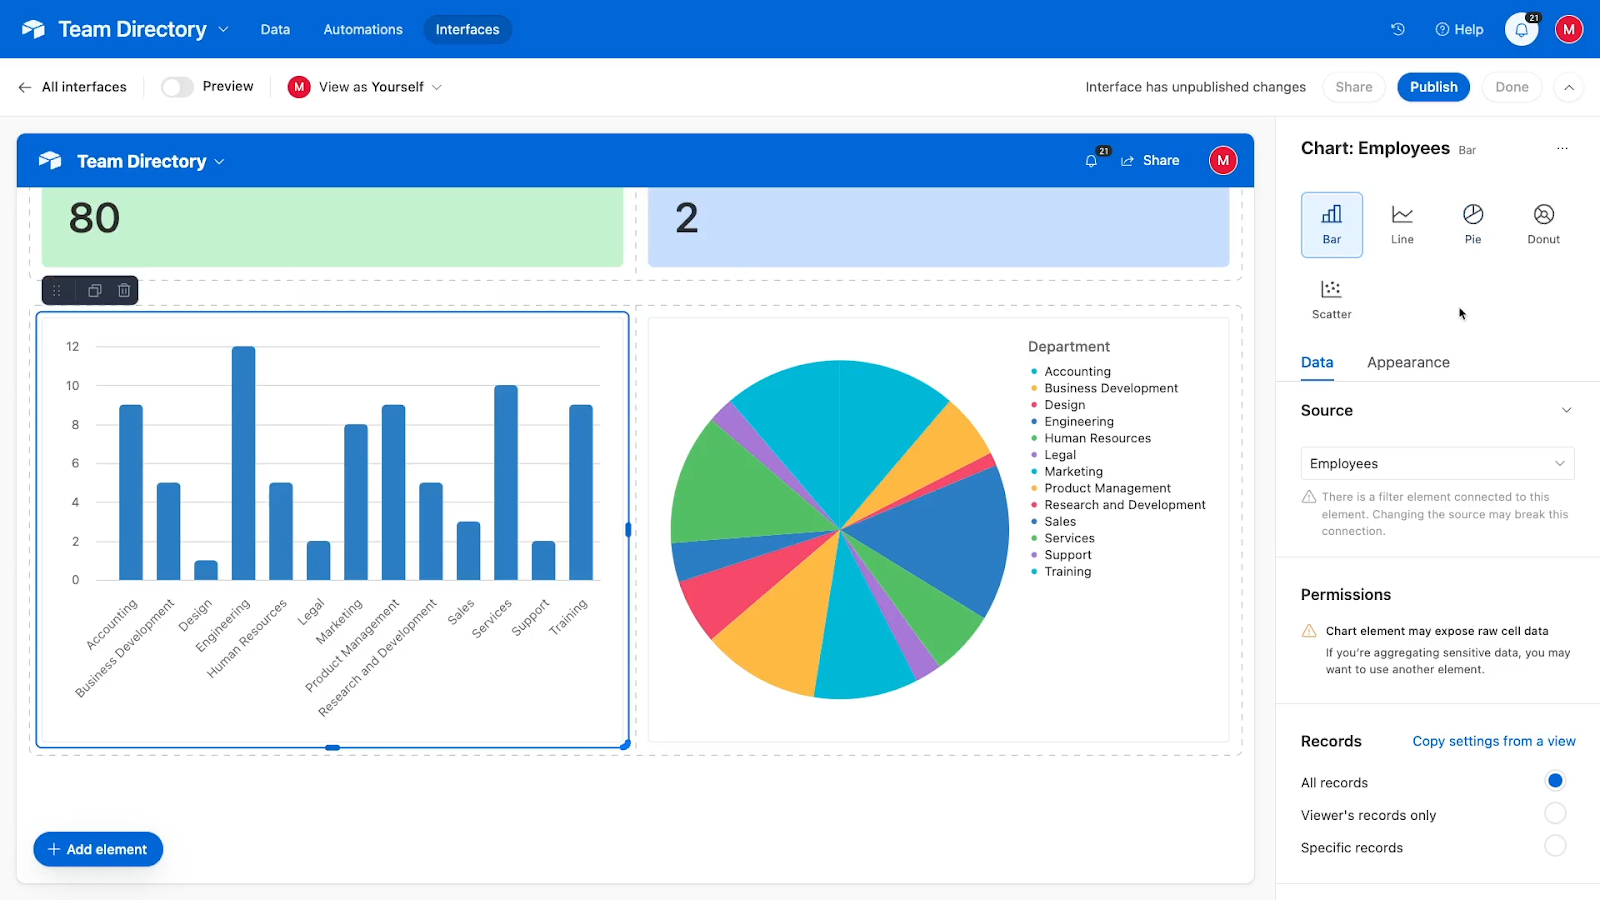
To edit the charts in your dashboard, just select them and configure your options in the panel on the right. You can change the chart type, the data source, and the appearance of the charts.
Just like the number elements, you can also resize these charts however you’d like.
Clicking on the “Add Element” button in the bottom left will let you add a new element to your page.
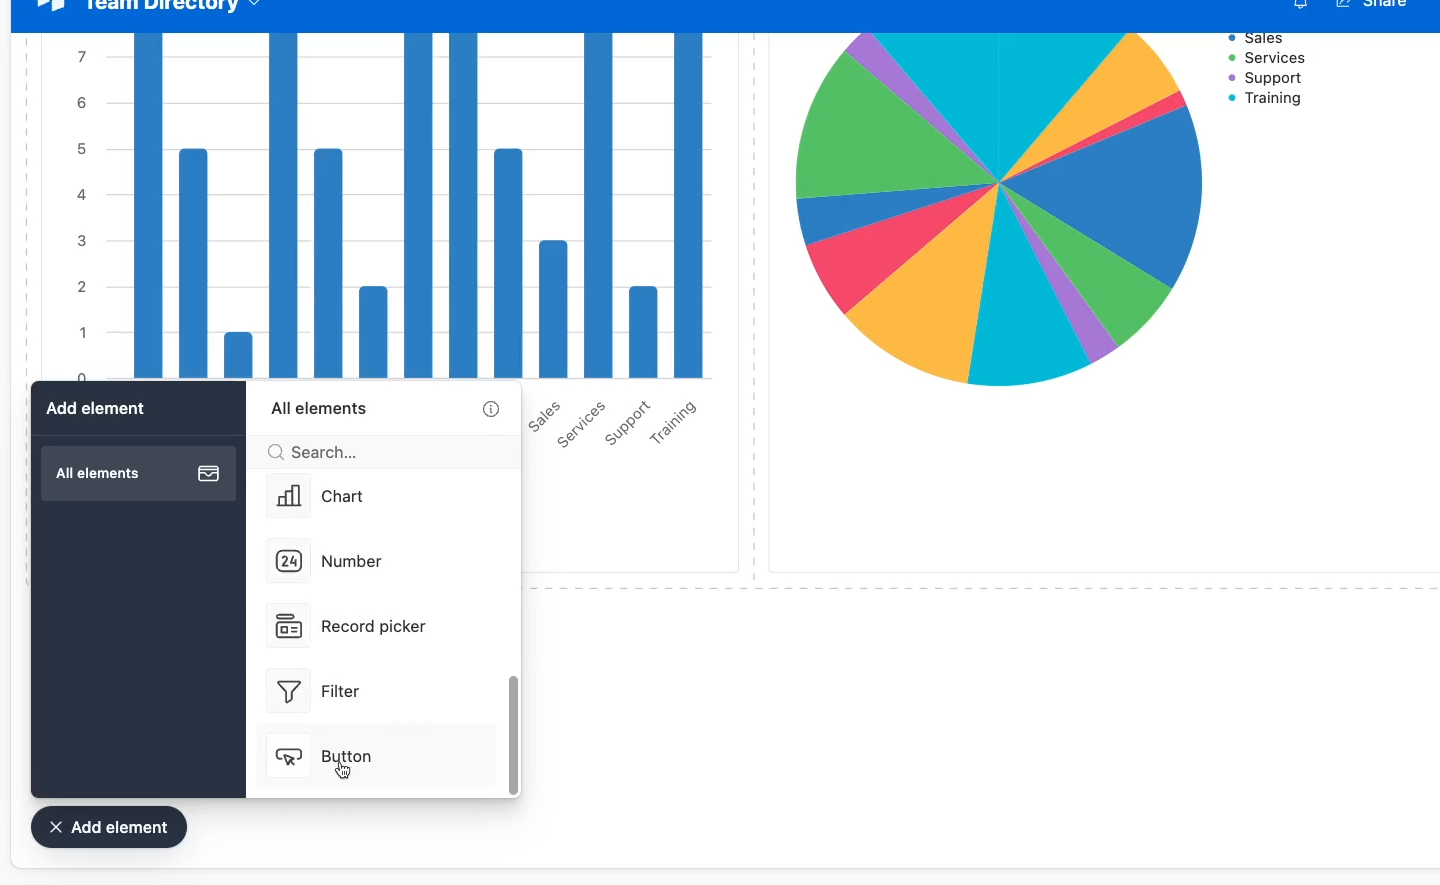
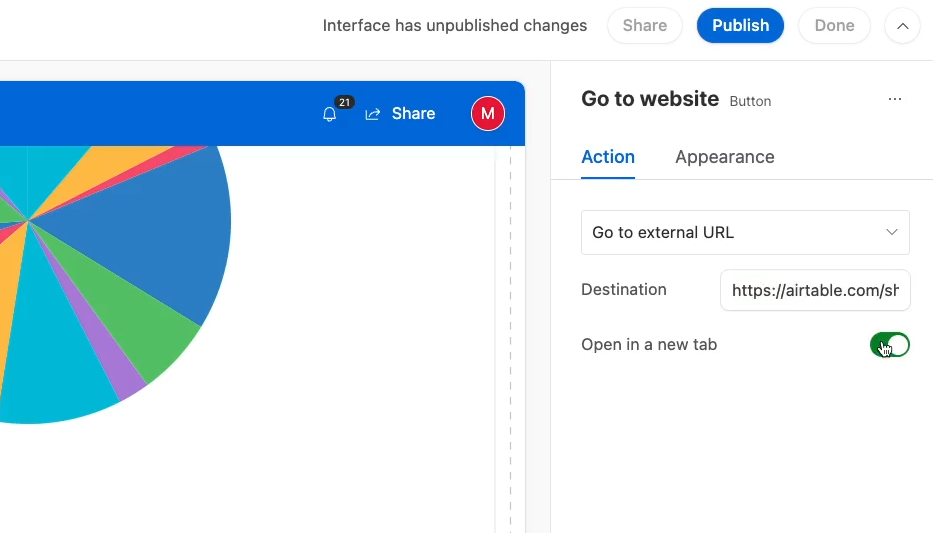
For instance, we added a button that links to our “Add a New Employee” form.
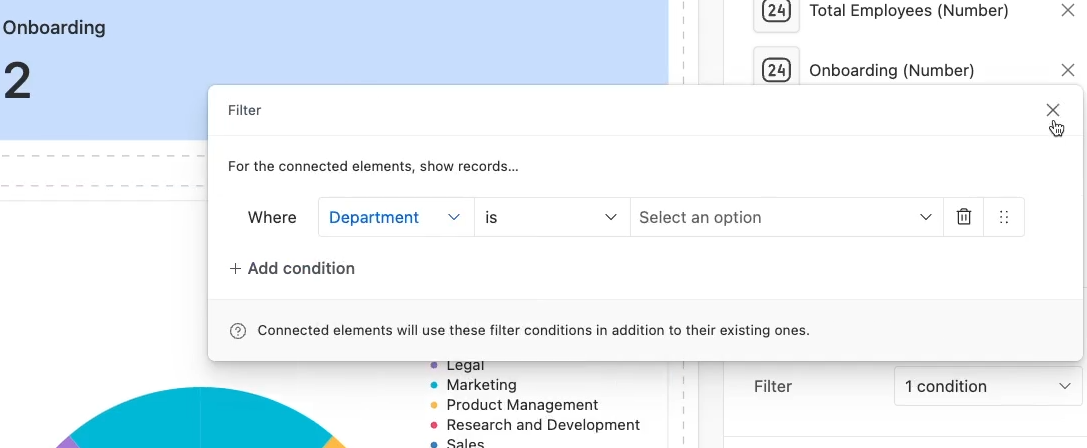
To wrap things up with this quick interface overview, let’s edit the filter that you see at the top of the page.
When we select it, we can see that there currently is no filter under the “Data” section.
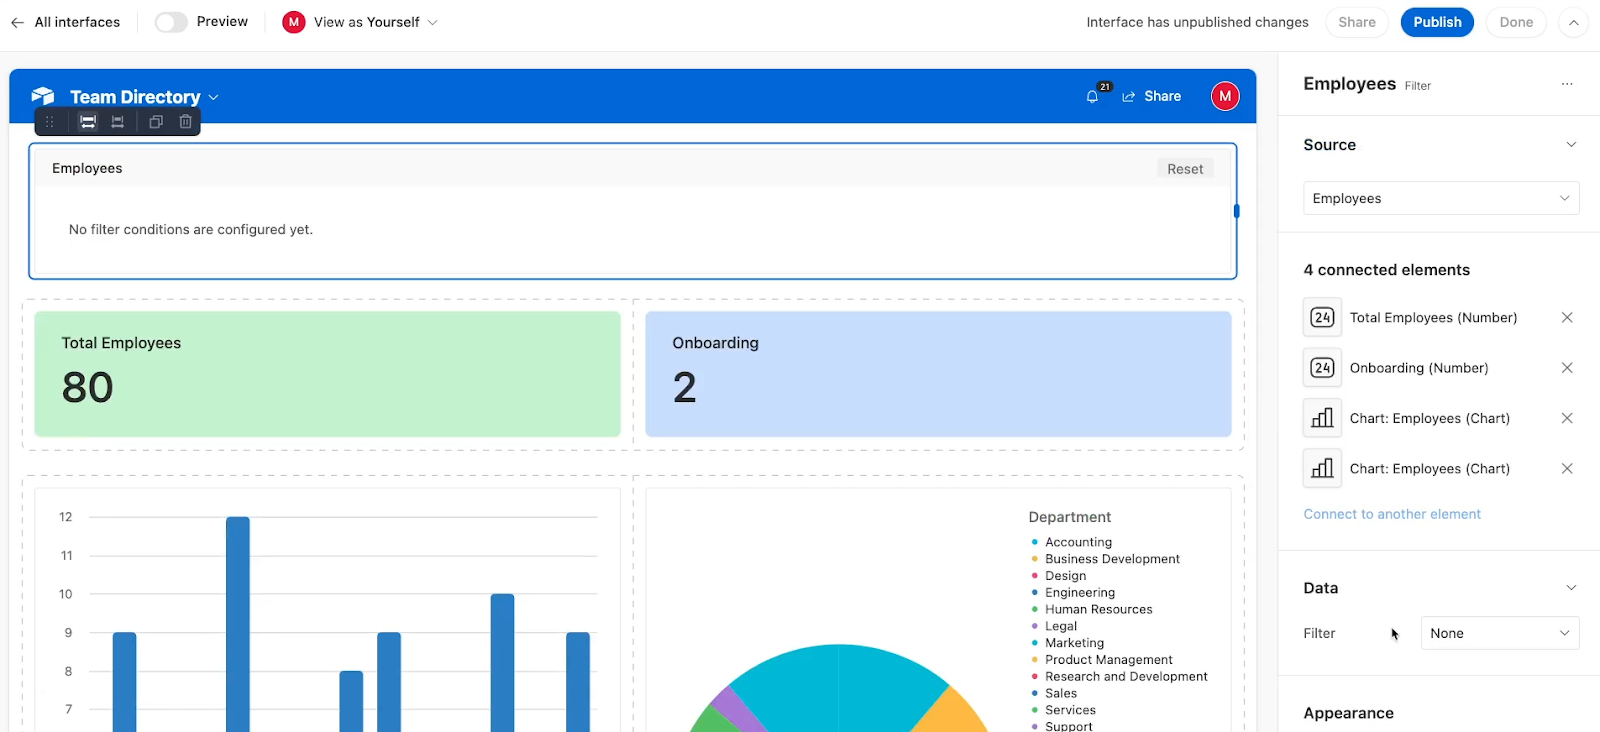
We’ll add a filter, select “Department is”, and leave the selection blank for now.
Now we can click on “Preview” to see what the published interface will look like.
When a user is looking at the interface, they’ll see all the data you configured, but they won’t be able to edit anything in this specific dashboard.
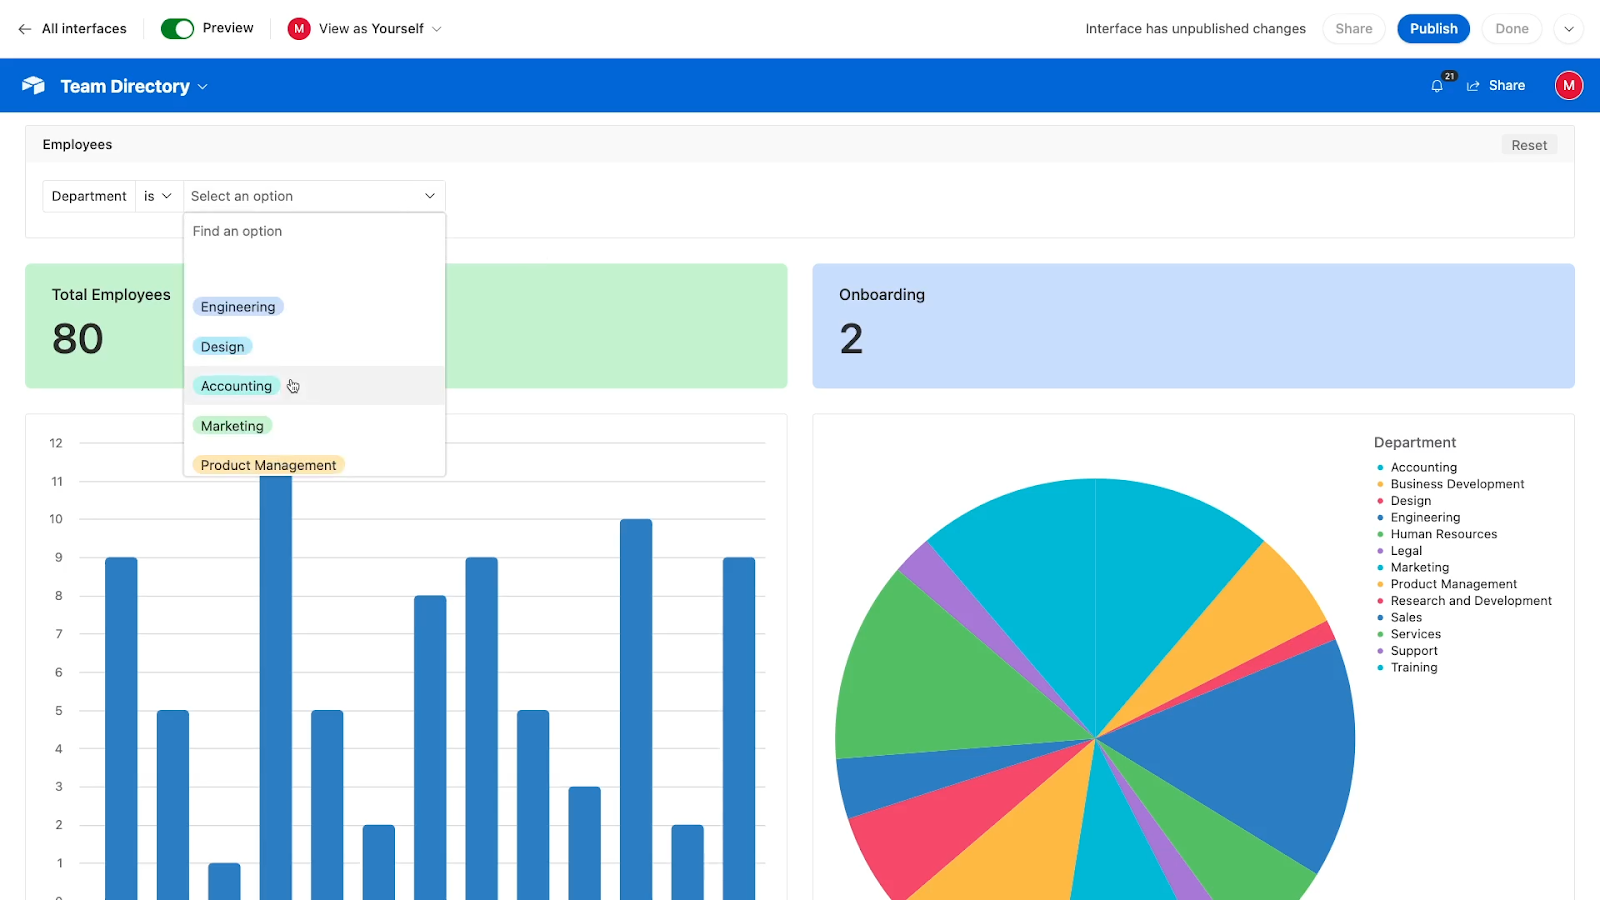
However, the user will be able to change this filter at the top to choose which departments they’d like to see.
Once you’re happy with your interface, click on “Publish” to configure permissions and create a shareable link for your dashboard.
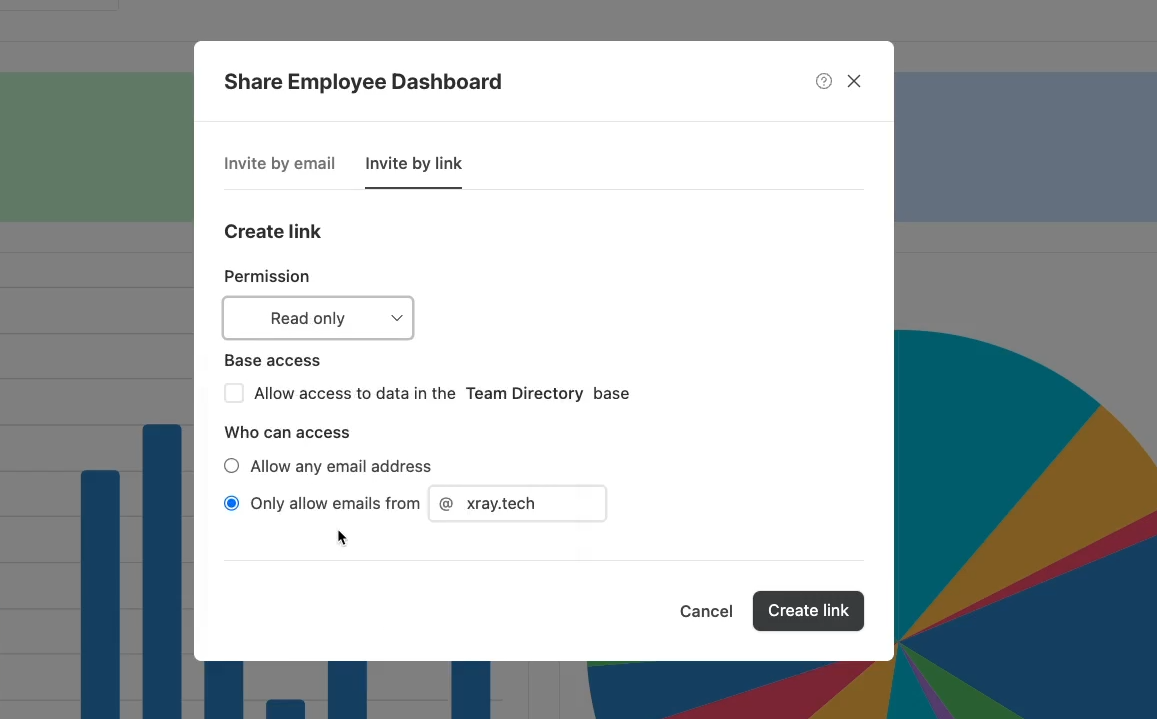
Using an interface is a great way to share reports or specific data without giving direct access to your database.
Configuring interfaces can be a little tricky, but you’ll get the hang of it with a little trial and error.
Once you’ve learned the ropes, you’ll be able to create some great new pages for displaying, summarizing, and sharing your data.
Airtable is a versatile tool that can be used in a variety of contexts, from personal organization to project management and beyond.
By following the walkthroughs in this guide, you can get started with Airtable and begin to see the benefits of using a flexible, customizable database to manage your data.
From creating your first table to adding automation and creating interfaces, Airtable offers a range of features that can help you streamline your workflow and improve your productivity.
Whether you're a beginner or an experienced user, there's always more to learn with Airtable, and we hope this guide has provided a solid foundation for your journey.
If you’d like to learn more about no-code automation and productivity, be sure to check out our blog or our YouTube channel. You can also follow XRAY on Twitter, Facebook, or LinkedIn.